
Laboratory work #1 "Measurement of voltages and signal levels using electronic voltmeters and level meters"
1. THE OBJECTIVE OF WORK
1.1 Study the operation principles of the digital voltmeters and signal level meters.
1.2 Study the voltage measurement procedures applying digital voltmeters and transmitter signal level meters.
1.3 Study the sources of systematic errors that emerge when ac voltages are measured with digital voltmeters.
1.4 Study the verification procedure of digital voltmeters in terms of estimating the ac voltage measurement error.
1.5 Study the measurement data processing algorithm in case of multiple indirect measurements of the four-pole network gain by measuring ac voltages at its input and output.
1.6 Acquire the practical skills of operating the generator Г4-117, digital voltmeters В7-28, ВЗ-38, ВЗ-40, В4-12, oscilloscope С1-72, and circuit noise meter 12XNO47.
2. BRIEF THEORETICAL INFORMATION
2.1 Voltage measurements with digital voltmeters
Voltage measurements are widely used
in radio electronics. These measurements feature a wide range of the measurable
quantities (from fractions of a microvolt up to hundreds of kilovolts), wide
frequency domain (from dc up to frequencies of thousands of MHz); huge diversity of signal shapes and low power
of supplies.
The instruments of sub-group B, where the following kinds are the most popular - B2 - dc voltmeters, B3 - ac voltmeters, B4 - pulsed ones, and B7 - multi-tasking voltmeters. DC voltmeters (kind B2) are designed in accordance with the schematics, shown in Fig. 2.1.
This kind of the voltmeters contain: input device (ID), dc amplifier (DCAmp) and moving-coil measuring mechanism (MCM). ID is an attenuator, functioning as the measurement range switch. It can also contain the devices to increase the voltmeter input resistance, for example, the source or grounded-collector amplifier. The DC Amp, in addition to signal amplification, serves to match the ID with MCM.
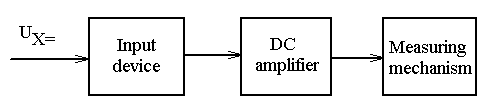
Figure 2.1
Voltmeter (ref. Figure 2.1) can be converted into an ac voltmeter by including an ac-dc converter into its circuit, namely the detector (D) (Figure 2.2,а).
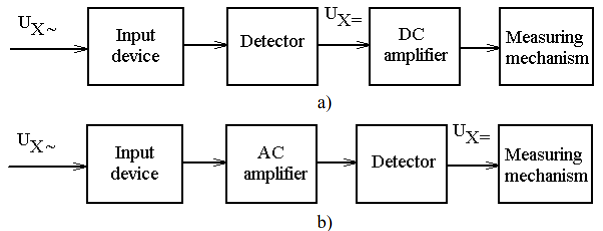
Figure 2.2
In that kind of a voltmeter the ac signal is converted into the dc voltage coming out of the ID, and then the dc voltage is amplified and measured. There is another way of building the ac voltmeter: the amplification can be performed in the ac amplifier (AC Amp) and only after that it is converted into he dc voltage (Figure 2.2,b). Practically all the ac voltmeters can be constructed following one of the schemes shown in Figure 2.2 or their combination. Therefore schemes like those are known as typical schemes. Pulsed voltmeters are usually designed using the first scheme to prevent possible signal distortion in by AC Amp.
Comparison of typical circuits makes it possible to make a number of conclusions regarding their features:
– the scheme with the detector at the input (ref. Figure 2.2,а) has a wider frequency range. The restrictions on the measurable voltage upper frequency are posed by the value of the input capacitance and frequency properties of the non-linear component of the detector, meaning that the frequency range is practically unlimited. It can be seen on the scheme (ref. Figure 2.2, b) that the restrictions result from the AC Amp pass band, which is technically difficult to gain wider than several dozens of MHz ;
– the scheme with the detector at the output (ref. Figure 2.2,6) has a higher sensitivity, restricted basically by the AC Amp inherent noise (these can reach few mcV). It can be seen on the scheme (ref. Figure 2.2,а) that the threshold sensitivity is limited by the opening threshold of the non-linear component (being 0.6...0.8 V).;
– from the scheme (ref. Figure 2.2,а) that prior to start measurements an additional operation, namely, "zero setting" in the DC Amp is required, not being the case of the second scheme. The present of the DC Amp causes another shortcoming in the first scheme : there is a possibility of temperature zero drift, which causes additional errors.
Electrical signals in the form of voltage are typically characterized through four key parameters, namely : the peak (amplitude) Um, average Uo, half-period average UCB, and root-mean square Urms values. The relation between these parameters can be established with the help of nondimensional amplitude FA and waveform FF coefficiencts
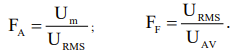 (2.1)
(2.1)
Their values depend on the signal shape. The average value determined the constant signal component and is very rare measured in practice.
Commercial ac voltmeters can have detectors of various types integrated, such as: rms, half-period average, or amplitude. Their scales are most often calibrated on root-mean square values of the sine voltage. Therefore when identical sine signals are measured, the voltmeter readings shall be the same and equal to Urms with any type of the detector integrated. However, when similar sine signals of a distorted or different from the sine shape are measured, the voltmeter having different detectors shall yield different readings . In this case in order to obtain a correct readout it is essential to take into consideration the calibration equation, that interlinks the voltmeter readings UV (calibration) and the physical parameter UX measured:
UV = C UX, (2.2)
where C is the calibration factor.
In fact the measurable parameter in an equation with (2.2) can be determined by the detector type solely and is not dependent on the signal shape. It is evident that when the scale calibration corresponds to the parameter UX, C = 1. In case there is a discrepancy between these parameters C can be derived through the known voltage values FA and FF used for calibrations.
For example, for a voltmeter with the half-period average detector the actual measurable parameter is UX = UAV. Since this scale is calibrated in UV = URMSsin, then according to (2.2) URMSsin = UAVsin. As the calibrating voltage is a since curve, for which URMS = FF UAV = 1,11 UAV, we shall obtain С = 1.11.
For the voltmeter with the amplitude detector UX = Um, Uv = URMSsin, hence Uскsin = C Umsin. At the same time URMS = Um/FA = Um/√2. Therefore С = 1/√2.
When measuring non-sine voltages with ac voltmeters it is essential to identify the detector type (actually measurable parameter) and the kind of the scale calibration from its technical description. If they correspond to each other, we can accept C=1, otherwise, use C to express parameter UX from equation (2.2.), and using the known indications calculate its value. In order to determine other parameters FA and FF of the measurable voltage must be known. In case the signal shape is known, these parameters can be estimated only experimentally, using the voltmeters with other types of detectors.
The pulsed voltmeters are designed solely with peak detectors and calibrated in amplitude values in the majority of cases. Consequently, for them C = 1, and there is no need to take into consideration the signal shape. However peak detectors may have open or closed input. Therefore the presence in the source signal of the constant constituent (U0 ≠ 0) may lead to incorrect results. Figure 2.3 shows signal shapes at the outputs of single and double wave rectifiers without any filter with equal amplitudes and different constant constituents U0.
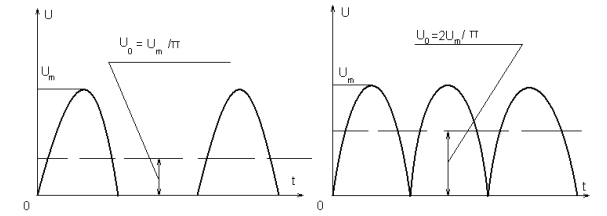
Figure 2.3
When measurements are carried out using a pulsed voltmeter with an open input, the measurement results will be the same and equal to Um. In case the polarity of the signal supplied has changed the results will be zero. If a pulsed voltmeter with closed input is used, the voltmeter shall indicate Um-U0, and in case of the polarity change - U0. At the same time as it can be seen from Fig.2.3, the results shall not be the same for two voltages with equal Um. In this case it is recommended to carry out measurements for both polarities, and then find Um as a sum of results.
However, in practice more complicated cases are possible (Figure 2.4).
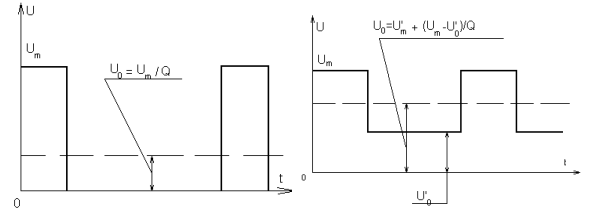
Figure 2.4
When measuring the peak value with the voltmeter with open input, the result for both signals is the same and equal to Um. In case of the closed input the results for the first signal shall be similar to the case considered earlier, i.е. Um-U0 and U0 when the polarity has changed. For the second signal with constant bias U'0 the result shall be Um – U0 and as the polarity has changed - U0 -U0. Therefore it is not recommended to use the voltmeter with the closed input for such cases.
The input resistance being the source of the systematic measurement error, is the one of the key voltmeter parameters. Using ac (unlike dc) it is possible to account for this error, if both active and reactive ZV components of the complete input voltmeter resistance are known Therefore the technical descriptions of the pulsed ac voltmeters usually include the values of the input resistance (active component) RV and input capacitance CV. These values can also be determined experimentally following the circuit plotted in Figure 2.5.
Two operating frequencies are selected for measurements, the first of which fH is selected low enough to neglect the influence of CV, i.е. XCv with RV. The second fB must be high enough in order to neglect the influence of RV, i.е. RV >> XCv. When the switch is in position 1, the voltmeter is connectable to the input of the source and allows measuring its output voltage UgH (at frequency fH) or UgB (at frequency fB). When the switch is in position 2, known active resistance R0 is enabled serially with the voltmeter, comparable in its value with RV.
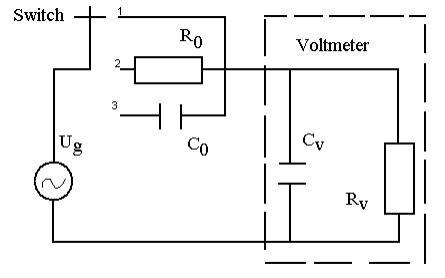
Figure 2.5
In position 3 the known capacitance is enabledвключается известная емкость С0. In this case at a low frequency fH in position 2 resistive R0, RV is formed, and at a high frequency fB in position 3 capacitance C0, CV - the dividers. After reading the voltmeter indications we can estimate UrV for the latter case and - UCv for the the former:
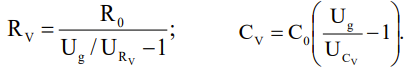 (2.3)
(2.3)
In order to decrease the influence of R0 and С0 spreads, it is necessary to perform a number of measurements, for instance for various values of R0 and С0. Then the measurement result for average RV and CV can be found as the arithmetic mean.
The instrumental errors are considered important metrology characteristics of any instrument (including digital voltmeters).
The instrumental error can be expressed as an absolute ( Δ ), relative ( δ ) and reduced ( γ ) errors
 (2.4)
(2.4)
 (2.5)
(2.5)
 (2.6)
(2.6)
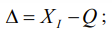
at the same time:
 (2.7)
(2.7)
where ХI - is the indication of an instrument;
Q - is the real value of a quantity (during verification the real value corresponds to the reading of the master instrument);
XN is the normalized value, which should be selected in accordance with the standard GOST 8.401.
It is allowed to use ХI in formulas (2.5) and (2.6) in place of Q.
The standard GOST 8.401 stipulates that if the instrument has an equidistant scale, the value XN should be selected equal to the measurement limit while finding the zero mark at the measurement range end or equal to the sum of the moduli of the measurement limits, when the zero mark is within the measurement range. If the instrument's scale is unevenly divided, the value XN can be accepted equal to the length of the scale or its part, corresponding to the measurement range.
The accuracy rating is a generalized characteristic of any instrument, restricted by the limits of the its permissible error. If these limits can be expressed through the values δ and γ by the below formulas
 (2.8)
(2.8)
where q and p are abstracted positive numbers, selected from the series
 (2.9)
(2.9)
then the accuracy ratings are designated by the numbers, equal to these limits (percentage) and correspond to the series (2.9). If the limits of the permissible errors are expressed through the value δ in the formula
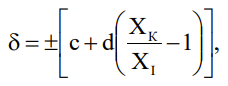 (2.10)
where ХК is a greater (in its modulus) measurement limit;
с and d – positive numbers, not dependent on the measurable value XI, the accuracy ratings are designated with the numbers с and d with a slash between them.
The instrument's accuracy ranting can be checked during the instrument verification, in particular by comparing the instrument indications with the indications of the master instrument and then estimating the error, normalized for the verifiable instrument.
Multiple direct or indirect measurements are performed in order to increase the measurement accuracy.
The digital both dc and ac voltmeters are widely spread, they contain analog-to-digital converters (ADC) of the measurable voltage. According to the analog-to-digital conversion method there are pulse-time, frequency-time, and code-time converters.
2.2 Measurements of the sound signal
levels
The
voltage of signals used in communication engineering vary from fractions of
picovolts up to dozens o volts. For the sake of convenience while measuring
voltages in a wide range an off-system dimensionless unit - decibel (dB) is
used [6], which can be expressed as
 (2.11)
In this case the signals are compared not in terms of absolute values, but in terms of logarithms of their voltage relation to some conditional values, accepted as the zero mark of the logarithmic scale. The resulted value is known as the signal level. Absolute, relative and measurement levels of voltage are distinguished. The absolute voltage level can be defined as
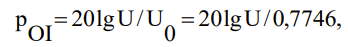 (2.12)
where U is the root-mean-square value of voltage in volts;
Uo - "zero" voltage value, definable from the condition that the "zero" power Ро = 1 mW is scattered in the resistor with resistance of Rg = 600 Ohm, that is U = √P0R0= 0,7746 В.
"Zero" power level P0 = 1 mW is recommended by the CCITT.
When the levels are estimated with reference to the value of voltage at a certain point of the circuit, such levels are named relative levels:
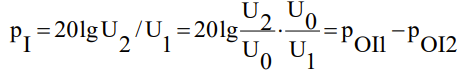 (2.13)
When a signal with an absolute 0 dB level is applied at the input of a circuit, the relative levels, defined with reference to the input, are called measurement levels and in this case these level will be in line with the absolute values.
The quality of information transmissin through a communication channel is fully determined by the aggregate of the transmitter circuit parameters. These parameters include various kinds of attenuations, and among them is the overall attenuation α0СТ, definable on condition the four-pole network is matched in terms of its input and output powers:
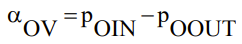 (2.14)
where роin and роout - are
the signal levels at the input and output of the four-pole network in dB,
correspondingly.
The signal transmission at various frequencies via a communication channel is characterized by the profile, including:
– the frequency response of the overall attenuation αov(f) within the operating frequency range from the lower boundary fH to the upper boundary fB ;
– the base measurement frequency f0, at which nominal values of the communication channel parameters are measured and normalized. The frequency f0 can be found usually within the operating frequency band;
– the frequency response of the deviation of the overall attenuation from its value at f0 frequency:
 (2.15)
– the effectively transmitted frequency band, at the boundaries of which αov and Δα ov differ from αov(f0) and Δαov(f0) no more than by a curtained normalized value.
When a signal is propagating in the communication channel, undistorted transmission of the waveform is essential, as well as the range of the transmitted signal levels. The amplitude response definable at the base measurement frequency, f0 is one of the parameters used to ensure these conditions:
 (2.16)
or
 . (2.17)
In communication engineering the voltage levels are
most often measured with the specific instruments known as level meters (LM)
with the scales calibrated in absolute voltage levels. The LM block diagrams do
generally comply with the ac digital voltmeters of second modification (ref.
Figure 2.2,b). The differences between LM and voltmeters can be accounted for
the specific nature of measurements in the communication channels, and are
related first of all to the design features of the input devices . As a rule,
LMs have symmetric and asymmetric inputs with reference to the ground. The LM input resistance may be either high or
low. The detectors used in LMs have a linear characteristic and may be either
peak or half-period average value detectors. In order to expand the dynamic
range of the measureable levels logarithmic converters of measurable signals
may be integrated in LM following the detector.
In practice when signal levels are measured at different checkpoints in the communication channel, there are two kinds of LM connection circuits, generally used - in parallel or "in series". In case of the parallel connection, LM with a high input resistance (ref. Figure 2.6, a) is linked at the junction of the components in the channel. In case of the "serial" connection, LM with low input resistance (ref. Figure 2.6, b) is linked to the output of the communication channel component in place of the subsequent part of the channel.
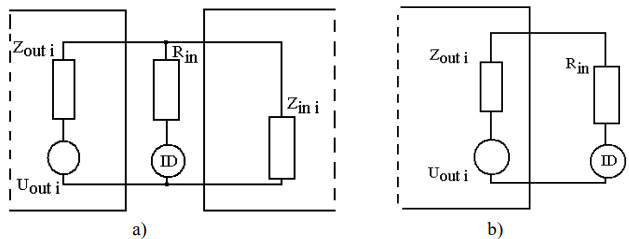
Figure 2.6
In case of the parallel connection the signal levels are measured without breaking the interconnections and operation of the channel. When the LM is connected "serially", the power matching condition must be necessarily fulfilled , and in this case directly the absolute power level Р0, scattered at Rin is measured.
3. INSTRUMENTATION TO BE USED DURING THIS LABORATORY PRACTICUM
3.1 Low-frequency signal generator Г4-117.
3.2 Multi-tasking digital voltmeter В7-28.
3.3 Millivoltmeter ВЗ-38.
3.4 Millivoltmeter ВЗ-40.
3.5 Pulsed current millivoltmeter В4-12.
3.6 Electron-beam oscilloscope С1-72.
3.7 Circuit noise meter 12XN047.
3.8 Laboratory models Ml and М2.
4.
DESCRIPTION OF LABORATORY MODELS
The
laboratory models M1 and M2 are used as a laboratory installation.
The model Ml (Figure 4.1) includes generators of sine-wave, saw-tooth. and "meander"-type voltages.

Figure 4.1
Using the WAVEFORM switch inputs of the corresponding voltage generators with the amplitude changed with the OPTION switch, are connected to the model's output. Using the switch ПЗ OPERATION MODE the measurement modes of the active resistance RV, capacitance CV for the voltmeter В7-28 or multiple measurements (MM) can be set. Variable resistance LEVEL is used for MM . Using the switch S4 INPUT - OUTPUT either the input or output of the four-pole network is connected to the model's output.
The digital voltmeter (either ВЗ-38 or ВЗ-40) can be verified when the switch S1 is in the position "VERIFICATION".
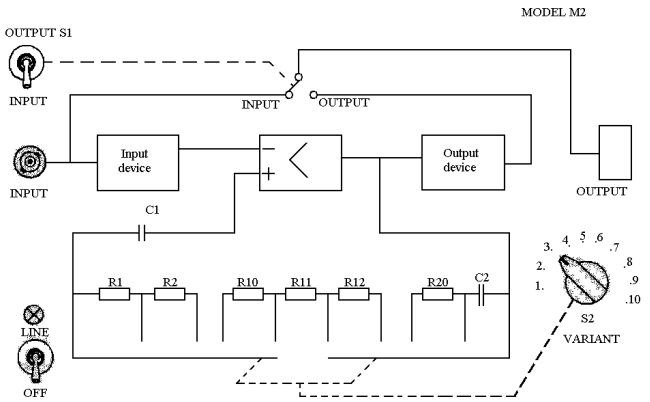
Mode М2
(Figure 4.2) contains an active band pass RC-filter, based on an opamp. The
switch П2
OPTION of the model varies the pass band and the gain of the filter. Using
switch П1
connect either the model's input or the RC-filter output is connected to the
output. Model М2 is
characterized by the following parameters: ROUT= 600 Ohm; operating
frequency band 100...5000 Hz; base measurement frequency f0 = 1 kHz.
Using the switch П1
INPUT-OUTPUT connect the circuit noise meter 12XN047 to the input and the
output of model М2. ![]()
![]()
Figure 4.2
5. PREPARATION TO THE WORK
5.1 Study the techniques
of the voltage measurements with the aid of digital voltmeters and signal level measurements with the level
meters described in the suggested reading.
5.2 Learn the instruments to be used during this laboratory work, reviewed in the annexes to this Guidelines, as well as the measurement procedure to be applied, and the method of estimating the results obtained.
5.3 Answer the advancement questions.
5.4 Prepare the draft of the report (one per group) on the laboratory work in compliance with the requirements given in these Guidelines.
5.5 Complete the home assignment and include it into the report draft.
The voltage of a signal of unknown waveform was measured with the aid of three voltmeters, having open inputs, with the scales calibrated in RMS values, and peak root-mean-square and half-period average value detectors. Determine the amplitude FA and waveform FF, factors if the readings of the voltmeter with the peak detector U1, with the rms detector U2, and with the half-period average value detector U3 are given in Table 5.1.
Table 5.1
|
Description of the parameter
|
Variant (group number) |
|||||||||
|
1. |
2 |
3 |
4 |
5 |
6 |
7 |
8 |
9 |
10 |
|
|
U1, mV |
26.4 |
515 |
42 |
72 |
276 |
15.7 |
152 |
61 |
550 |
246 |
|
U2, mV |
24.6 |
455 |
36 |
58 |
216 |
12.4 |
113 |
44 |
380 |
174 |
|
U3, mV |
24.2 |
440 |
33 |
49 |
178 |
9.5 |
86.6 |
32 |
280 |
110 |
6. LABORATORY ASSIGNMENT
6.1 Measure ac voltage with voltmeter В7-28. Estimate the ac voltage istrumental measurement errors.
6.2 Define the input resistance RV and input capacitance CV of voltmeter В7-28.
6.3 Perform verification of voltmeter ВЗ-38 or ВЗ-40 in terms of finding the ac voltage measurement error with voltmeter В7-28 used as a master instrument . Estimate the absolute, relative and reduced errors of voltmeter ВЗ-38 or ВЗ-40 when measuring ac voltage.
6.4 Carry out multiple indirect measurements of the gain Кп of the four-pole network using voltmeter В7-28 by measuring ac voltages at the input and output of the four-pole network.
6.5 For the given signals of various waveforms define the peak Um, RMS Urms, and half-period average Uhp values of voltage, the amplitude factor FA andshape coefficient FF.
6.6 Read the frequency response of the overall attenuation for model М2 using instruments Г4-117, 12XN047.
6.6 Read the amplitude response of the overall attenuation for model М2 using instruments Г4-117, 12XN047.
7. ORDER OF COMPLETION
Each group is supposed to complete the assignment according to the number of its variant, which coincides with the group number.
7.1 Carry out measurements in accordance with 6.1 of the assignment to the Laboratory work.
7.1.1 Prepare generator Г4-117 and voltmeter В7-28 for operation in compliance with А.4 in Annex А.1 and B.4 in annex B, respectively. Set the switch ВОЛЬТМЕТР on generator Г4-117 to the position "3В".
7.1.2 Set the power toggle of model М1 to the OFF position, and switch П1 - to "КЗ" position. The connector "Вход Г4-117" on model Ml with a cable connect to the connector "3В" on generator Г4-117, and the terminals Нх and Lxy of the input cable of voltmeter В7-28 connect with clamps "Выход В7-28"
7.1.3 In compliance with А.5 of Annex А set the first values of the frequency f and voltage U, given in Table 7.1, on generator Г4-117. Using voltmeter В7-28 measure voltage UV in the manual limit selection mode in compliance with B.5 of Annex B. Enter the values f, U, UV, as well as the limit Ulim of voltmeter В7-28, used for measurements, into Table 7.2.
7.1.4 Repeat operations, described in 7.1.3, for other three values of the frequency f and voltage U, given in Table 7.1.
Table 7.1
|
Group number (variant ) |
1. |
2 |
3 |
4 |
5 |
6 |
7 |
8 |
9 |
10 |
|
|
0.2 |
0.3 |
0.4 |
0.5 |
0.6 |
0.6 |
0.5 |
0.4 |
0.3 |
0.2 |
|
f, kHz |
1.0 |
2.0 |
3.0 |
4.0 |
5.0 |
1.2 |
1.5 |
2.5 |
3.5 |
4.5 |
|
|
6.0 |
7.0 |
8.0 |
9.0 |
10 |
12 |
14 |
16 |
18 |
20 |
|
|
25 |
30 |
35 |
40 |
50 |
60 |
70 |
80 |
90 |
100 |
|
|
0.6 |
0.06 |
1.0 |
1.6 |
0.5 |
0.09 |
0.6 |
2.5 |
2.2 |
0.1 |
|
U, V |
0.08 |
0.8 |
0.05 |
2.4 |
1.8 |
0.7 |
0.06 |
0.8 |
1.0 |
1.8 |
|
|
3.0 |
0.1 |
2.0 |
0.07 |
0.6 |
1.5 |
0.15 |
0.07 |
0.4 |
0.05 |
|
|
1.2 |
2.4 |
0.8 |
0.4 |
0.04 |
0.1 |
2.0 |
3.0 |
0.08 |
0.7 |
|
UG , V |
1.0 |
1.5 |
2.0 |
2.5 |
3.0 |
1.0 |
1.5 |
2.0 |
2.5 |
3.0 |
|
fB, Hz |
20 |
25 |
30 |
35 |
40 |
40 |
30 |
35 |
25 |
20 |
|
fT, kHz |
40 |
45 |
40 |
55 |
60 |
60 |
55 |
40 |
45 |
50 |
|
fP, kHz |
0.1 |
0.2 |
0.5 |
1.0 |
2.0 |
5.0 |
10 |
20 |
50 |
100 |
|
Kind of verifiable voltmeter |
ВЗ-38 |
ВЗ-40 |
ВЗ-38 |
ВЗ-40 |
ВЗ-38 |
ВЗ-40 |
ВЗ-38 |
ВЗ-40 |
ВЗ-38 |
ВЗ-40 |
|
Measurement limit Ulim, V |
3.0 |
0.30 |
1.0 |
3.0 |
0.30 |
1.0 |
0.30 |
3.0 |
1.0 |
0.30 |
|
|
0.50 |
0.05 |
0,10 |
0.50 |
0.05 |
0,10 |
0.05 |
0.50 |
0,10 |
0.05 |
|
|
1.0 |
0,10 |
0.30 |
1.0 |
0,10 |
0.30 |
0,10 |
1.0 |
0.30 |
0.10 |
|
UM, V |
1.5 |
0.15 |
0.50 |
1.5 |
0.15 |
0.50 |
0.15 |
1.5 |
0.30 |
0.15 |
|
|
2.0 |
0.20 |
0.80 |
2.0 |
0.20 |
0.80 |
0.20 |
2.0 |
0.80 |
0.20 |
|
|
3.0 |
0.30 |
1.0 |
3.0 |
0.30 |
1.0 |
0.30 |
3.0 |
1.0 |
0.30 |
|
fM, kHz |
20 |
60 |
30 |
10 |
40 |
30 |
50 |
40 |
60 |
10 |
|
n |
23 |
21 |
19 |
17 |
15 |
15 |
17 |
19 |
21 |
23 |
|
PD |
0.95 |
0.99 |
0.95 |
0.99 |
0.95 |
0.99 |
0.95 |
0.99 |
0.95 |
0.99 |
7.1.5 Using formulas given in Table B.1 of Annex B and formula (2.5),
calculate the maximal permissible instrumental relative δU and
absolute ΔU voltage measurement errors . Enter the calculation results into
Table7.2.
Table 7.2
|
Srl № |
f, kHz |
U, V |
Ulim, V |
UV, V |
δU % |
ΔU |
|
1. |
|
|
|
|
|
|
|
2 |
|
|
|
|
|
|
|
3 |
|
|
|
|
|
|
|
4 |
|
|
|
|
|
|
7.2 Carry out measurements in accordance with 6.2 of the assignment to the Laboratory work.
7.2.1 Set the power toggle of model Ml to the OFF position, and switch ПЗ -to the position "Rin, Cin", switch П1 - to the position "КЗ".
7.2.2 Set generator Г4-117 to the frequency of fB and voltage UG, given in Table 7.1. Enter the values UG and fB to Table 7.3. Measure the voltage UGB using voltmeter В7-28 in the automatic limits selection mode in accordance with point 5 of Annex 2. Enter UGB measurement result into Table 7.3.
Table 7.3
|
UГ, V |
fB, (Hz). |
UGB, V |
Ro, kOhm. |
URV, V |
RV, kOhm. |
<RV>, kOhm. |
fT, (Hz). |
UGT, V |
Со, (pF). |
UCV, V |
CV, (pF). |
<СV >, (pF). |
|
|
|
|
560 |
|
|
|
|
|
30 |
|
|
|
|
|
|
|
1000 |
|
|
|
|
|
20 |
|
|
|
|
|
|
|
270 |
|
|
|
|
|
10 |
|
|
|
7.2.3 On the model Ml set the switch П1 to the position “R0”, and the switch П2 - to the position "560 kOhm". Measure the voltage URV with the voltmeter В7-28 in the automatic limits selection mode. Enter UGB measurement result into Table 7.3.
7.2.4 Repeat steps described in 7.2.3, for the positions of switch «П2», «1 MOhm», and «270 kOhm».
7.2.5 Involving the values UGB, URV, R0 and formula (2.3), calculate the values of RV for three different values of R0 (560 kOhm 1 MOhm, 270 MOhm) and averaged value <Rv>. Enter the calculation results into Table7.3.
7.2.6 Set generator Г4-117 to the frequency of fT and voltage UG, given in Table 7.1. Enter the values fT into Table 7.3. On the model Ml set switch П to the position "КЗ" and measure the voltage UGT with voltmeter В7-28 in the automatic limits selection mode. Enter UGT measurement result into Table 7.3.
7.2.7 On the model Ml set switch П1 to the position "С0", switch П2 - to the position "30 pF". Measure the voltage UCV with voltmeter В7-28 in the automatic limits selection mode. Enter UCV measurement result into Table 7.3.
7.2.8 Repeat steps described in 7.2.7, for the positions of switchП2 "20 pF" and "10 pF".
7.2.9 Using the values of UGT, UСV, C0 and formula (2.3), calculate the values of CV for three different values of С0 (30 pF, 20 pF, and 10 pF) and the averaged value <CV >. Enter the calculation results into Table7.3.
7.2.10 On the basis of the maximal permissible values of the input resistance and capacitance described for voltmeter В7-28 in the technical description (point 2.5 Annex 2), make a conclusion on the compliance of the measured characteristics (RV, СV) given in the technical description.
7.2 Carry out measurements in accordance with 6.3 of the assignment to the Laboratory work.
7.3.1 Set the power toggle of the model Ml to the OFF position, and switch ПЗ - to the position “RBX, CBX”.
7.3.2 Prepared the verifiable voltmeter, the kind of which is specified in Table 7.1, for operation. (ВЗ-38 or ВЗ-40), as per point C.4 of Annex C or point D.4 in Annex D. Link the connector “→)” on the verifiable voltmeter with the cable to the corresponding connector ( on "ВЗ-38" of "ВЗ-40") in the model Ml. Set the verifiable voltmeter to the limit UIF, given in Table 7.1.
7.3.3 set Switch П1 to the position «VERIFICATION». Set the frequency of generator Г4-117 to fP, given in Table 7.1. With the knob REG. OUT on generator Г4-117 set the hand of the verifiable voltmeter to the mark that corresponds to the first voltage value UM, given in Table 7.1. Then set switch П1 to the position “КЗ”. Measure the voltage U0 with voltmeter В7-28 in the automatic limits selection mode. Enter the values fP, UIM, UM, U0 into Table 7.4.
Table 7.4
|
Srl № |
fP, kHz |
Ulim, V |
UM, V |
U0, V |
ΔM, V |
ΔM, % |
ΓM, % |
|
1. |
|
|
|
|
|
|
|
|
2 |
|
|
|
|
|
|
|
|
3 |
|
|
|
|
|
|
|
|
4 |
|
|
|
|
|
|
|
|
5 |
|
|
|
|
|
|
|
7.3.4 Repeat operations, described in 7.3.3 for the remaining four values of voltage UM given in Table 7.1
7.3.5 Calculate the absolute ΔM, relative δM and reduced γM errors of the verifiable voltmeter, employing formulas (2.4), (2.5) and (2.6). Enter the calculation results into Table7.4.
7.3.6 Make a conclusion on the voltmeter verification results in terms of estimating the voltage measurement error.
7.3.7 Disable the verifiable voltmeter and disconnect it from the model М1.
7.4 Carry out measurements in accordance with point 6.4 of the assignment to the Laboratory work.
7.4.1 Set the power toggle on the model Ml to the OFF position, switch ПЗ - to the position «МИ», and the switch ВХОД-ВЫХОД set to the position ВХОД.
7.4.2 Set the frequency of generator Г4-117 to fB and the voltage to UG, both given in Table 7.1.
7.4.3 Set the knob УРОВЕНЬ on the model Ml to its extreme left position. Switch the knob УРОВЕНЬ to the position «1» and read the indication of voltmeter В7-28 UIN in the automatic limits selection mode . Set the switch ВХОД-ВЫХОД to the position «ВЫХОД» and read the indication of voltmeter В7-28 Uout in the automatic limits selection mode . Enter the values UIN and UOUT into Table 7.5. Set the switch ВХОД-ВЫХОД to the position «ВХОД».
7.4.4 Repeat the steps described 7.4.3 n times (the quantity n is given in Table 7.1).
7.4.5 Process the indirect multiple measurement results and calculate the gain of the four-pole network (КП=UIN/UOUT) in compliance with recommendations, described in [1,13,14]. Present the processing algorithm in the report on the Laboratory work. The confidence probability РC can be selected from Table 7.1. Represent the measurement data in the format following the requirements of the standards GOST 8.201-76 or МИ 1317-76, and enter it into Table 7.5.
Table 7.5
|
Number of tests |
1. |
2 |
... |
i |
… |
n-1 |
n |
|
UIN, V |
|
|
|
|
|
|
|
|
UOUT, V |
|
|
|
|
|
|
|
|
Measurement data |
КП= ...; РC= ... |
||||||
7.4.6 Disable the instruments Г4-117 and В7-28 and disconnect them from the model M1.
7.5 Carry out measurements in accordance with point 6.5 of the assignment to the Laboratory work.
7.5.1 Prepare voltmeters ВЗ-38, ВЗ-40, and В4-12 and oscilloscope С1-72 for operation in compliance with points C.4, D.4, E.4, F.4 of the corresponding Annexes. Using the cables link the output connectors кабелей of these instruments with the respective connectors ( on "ВЗ-38", “ВЗ-40", or В4-12", "С1-72") of the model Ml. Set the switch OPTION on the model Ml to the position, that coincides with number of the variant (group), and the switch WAVEFORM - to the position 1. Set the power toggle of the model Ml to the position «ON».
7.5.2 Measure the output voltages of the model Ml UВ3-38, UВ3-40, UВ4-12 using the voltmeters ВЗ-38, ВЗ-40, or В4-12 following either point C.5, D.5, E.5 of the corresponding Annexes. Control the shape of the voltage employing oscilloscope С1-72 (F.5 of Annex F). Repeat the measurements for the positions 2-5 of the switch WAVEFORM. Enter the measurement data as well as the limits ULM В3-38, ULM В3-40, ULM В4-12 within which the measurements have been performed, into Table 7.6.
7.5.3 Employing the measurement data and applying the formulas (C.1) of Annex C, (D.1) of Annex D and (П5.1) of Annex 5, determine the peak Um, RMS URMS, and half-period average UAV values of the voltages under study, and derive the amplitude factors FA and form factor FF from formulas (2.1). Using formula (2.7), the values of the instrumental reduced errors for voltmeters ВЗ-38, ВЗ-40, and В4-12 (C.2, D.2, E.2 in Annexes C - F), the limits ULM В4-12, ULM В3-40, ULM В3-38, determine the maximal permissible instrumental relative errors δUВ3-38, δUВ3-40, and δUВ4-12.
7.5.4 Set the power toggle of model Ml to the OFF position. Disable instruments В4-12, ВЗ-40, ВЗ-38, and С1-72 and disconnect them from the model Ml.
Table 7.6
|
Checkpoint number |
1. |
2 |
3 |
4 |
5 |
|
Waveform |
|
|
|
|
|
|
UВ4-12, mV |
|
|
|
|
|
|
UПР В4-12, mV |
|
|
|
|
|
|
UВ3-40, mV |
|
|
|
|
|
|
ULM В3-40, mV |
|
|
|
|
|
|
UВ3-38, V |
|
|
|
|
|
|
ULM В3-38, mV |
|
|
|
|
|
|
Um, V |
|
|
|
|
|
|
URMS, V |
|
|
|
|
|
|
UAV, V |
|
|
|
|
|
|
FA |
|
|
|
|
|
|
FF |
|
|
|
|
|
|
δUВ4-12, % |
|
|
|
|
|
|
δUВ3-40, % |
|
|
|
|
|
|
δUВ3-38, % |
|
|
|
|
|
7.6 Perform measurements as per point 6.6 of the Laboratory work
assignment.
7.6.1 Prepare generator Г4-117and circuit noise meter 12XN047 for operation in accordance with point А.4 of Annex А and H.4 of Annex H.
7.6.2 Set the switch OPTION on the model М2to the position, corresponding to the number of variant (group). Through the cable link the connector "3V" on generator Г4-117 to the connector INPUT on the model М2, and to the plugholes OUTPUT on the model М2 - connect the plugholes of the symmetric input SYM. INPUT. on the circuit noise meter 12XN047.
7.6.3 Set the output signal of generator Г4-117 to UГ = 300 mV and its frequency to fГ = 20 H.z Set the operation mode switch on circuit noise meter 12XN047 to the position LIN, and the measurement range switch - to the position "+10 dB".
7.6.4 Set the switch INPUT-OUTPUT on the model М2 to the position INPUT and enable the model М2. According to point H.5 of Annex H measure the value of the input signal РОIN using circuit noise meter 12XN047. Set the switch INPUT-OUTPUT to the position OUTPUT and measure the value of the output signal РОOUT . Enter the measurement data (РОIN and РОOUT) into Table 7.7.
Table 7.7
|
fГ, kH\ |
0.02 |
0.1 |
0.5 |
1.0 |
2.0 |
5.0 |
10.0 |
20.0; |
|
PОIN, dB |
|
|
|
|
|
|
|
|
|
PОOUT, dB |
|
|
|
|
|
|
|
|
|
αОСТ, dB |
|
|
|
|
|
|
|
|
|
ΔαОСТ(f), dB |
|
|
|
|
|
|
|
|
7.6.5 By tuning the frequency of generator Г4-117, carry out measurements of the levels РОIN and РОOUT at all the frequencies, presented in Table. 7.7 Enter the measurement data into Table7.7.
7.6.6 Using the measurement data perform the following calculations: from formula (2.14) derive αОСТ and from (2.15) derive ΔαОСТ(f) for each frequency, at which the measurements have been carried out (f0 = 1 kHz).
7.7 Perform measurements in compliance with point 6.7 from the Laboratory work assignment.
7.7.1. Set the frequency of generator Г4-117 to f0 = 1 kHz and, gradually varying the generator output in voltage, as indicated in Table 7.8, measure the values of signal levels РОIN and РОOUT for the measurements РОIN and РОOUT and enter into Table 7.8.
7.7.2 Similarly to steps described in 7.6.6, calculate αОСТ.
7.7.3 Plot the αОСТ -РОIN curve αОСТ=f1(PОIN).
Table 7.8
|
Ug, mV |
3000 |
2000 |
1000 |
500 |
100 |
50 |
10 |
5 |
1. |
0.5 |
|
PОIN, dB |
|
|
|
|
|
|
|
|
|
|
|
PОOUT, dB |
|
|
|
|
|
|
|
|
|
|
|
αОСТ, dB |
|
|
|
|
|
|
|
|
|
|
7.7.4 Disable the instruments Г4-117 and 12XN047 and disconnect them from model М2.
8. CONTENTS OF THE REPORT
The report on the Laboratory work should be issued on standard paper sheets. The contents of the report must contain the objective of the work, the laboratory assignment, all the necessary data describing the instruments under study (В7-28, ВЗ-38, ВЗ-40, В4-12, 12XN047) and the work done, as well as the conclusions. The measurement and calculation data must be summerized in Tables, following the guidelines, given here. The report must include the working diagrams, calculation formulas, used in the experiments and for processing of the data obtained , as well and the conditions and the course of solving the problem, given in point 5.5 of these guideline instructions.
The description of the measurement instrumentation involved must be drawn in comliance with the blank, given in Table 8.1.
Table 8.1
|
Srl № |
Name of the instrument |
Kind of the instrument |
Serial number |
Key technical specifications |
|
|
|
|
|
|
9. ADVANCEMENT QUESTIONS
1 The application of the digital
voltmeters, their advantages and disadvantages.
2 Classification of the digital voltmeters and their technical specifications.
3 Typical circuits of the digital analog dc voltmeters, their features.
4 Digital voltmeters that use the pulse-time processing method with two-cycle integration (operation principles, pros and cons).
5 Typical circuits of the digital analog ac voltmeters, their features.
6 Parameters of the input circuit of digital analog ac voltmeters, their features.
7 Types of detectors, used in digital ac voltmeters (operation principles, features).
8 Voltage characteristics of the ac signals, their interconnections.
9 The impact of the shape of the measurable voltage on the voltmeter indications.
10 Specific features of measuring the voltage with peak-type voltmeters.
11 The order of selecting the voltmeter to measure the voltage in radio engineering circuits.
12 Absolute, relative, and reduced instrumental error.
13 The accuracy ratings of the instruments.
14 Verification of instruments in terms of estimating the measurement errors.
15 Processing algorithm of the observation data in case of indirect measurements.
16 Specific features of measuring the voltage level in transmitter circuits and the requirements to the level meters.
17 Typical flow-chart of the level meter, calibration of its readout scales.
18 Research of the communication channels with level meters (reading the level diagram and estimation of the residual attenuation)
19 Reading the amplitude and frequency responses of the communication channel using level meters.
APPENDIX А
HIGH-FREQUENCY SIGNAL GENERATOR Г4-117
А.1 APPLICATION
Generator Г4-117 is applied to test and adjust various-purpose broadband systems and vidio frequency devices.
А.2 KEY TECHNICAL SPECIFICATIONS
А.2.1 The generated frequency range: from 20 Hz up to 10 MHz (six subranges). Basic frequency setting range does not exceed ±(0.02 f + l) Hz, at the length of 100...200 Hz - does not exceed ±(0.02f + 4) Hz.
А.2.2 The voltage output can be controlled within 100 mcV ... 3 V in steps of 10 dB by the staged attenuator; smoothly controled within each stage with the knob CONT.OUT (output "3 V"); within (3...30) V - in 2MHz frequency band (1...5 subranges) and (3...20) V - in (2...10) MHz frequency band (6th subrange) at "30 V" output - only with the knob CONT.OUT The basic output voltage setting error on the hand indicator scale does not exceed +10 % of the nominal end value of the corresponding scale.
А.3 GENERATOR OPERATION PRINCIPLE
А.3.1 The block diagram of generator Г4-117 is plotted in Figure А.1. The layout and the position of the controls on the front panel are show in Figure А.2.
А.3.2 RC-generator is made with the Wien bridge. The frequency band can be selected with the subrange switch MULTIPLIER - MHz, and the operating frequency - with the knob FREQUENCY (ref. Figures А.1, А.2).
А.3.3 Sine waveforms from the RC-generator arrive to the controllable amplifier and are amplified up to 3 V with the HF amplifier. A part of the signal goes from the HF amplifier to the AGC system, being detected and compared to the reference level UОП. As as result dc voltage is generated which controls the controllable amplifier. In such a way the voltage at the HF amplifier output is determined by the value UОП, being established by the potentiometer REG. OUT.
А.3.4 The signal from the HF amplifier goes through the high-voltage amplifir to the output "30V" and then to the output "3V" through the staged attenuator. The output signal level is determined with the voltmeter, which is enabled at the HF amplifier output with the switch VOLTMETER (attenuator input) or to the high-voltage amplifier output (position 1 or 2).
А.4 PREPARARION OF THE INSTRUMENT FOR OPERATION
А.4.1 Prior to start operating the instrument learn the application of the controls, located on its front panel.
А.4.2 Set the knob REG. OUT to its extreme left position.
А.4.3 Switch on the instrument's power with the power cord and set the toggle to the position MAINS. As a result the signal lamp should start glowing. Warm the instrument up during 2...3 min.
А.4.4 During the self warm-up time ensure the
operability of the instrument.
For this purpose it is essential to:
– press one of the keys on the switch MULTIPLIER-MHz;
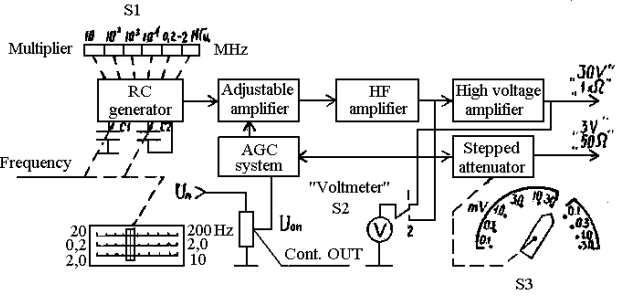
Figure А.1
set the toggle VOLTMETER to its extreme right position, and by rotating the knob REG. OUT, make sure the voltage can be observed at the output "3 V".
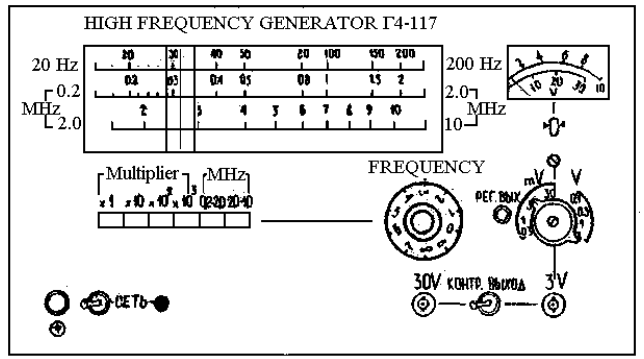
Figure А.2
А.5 MEASUREMENT PROCEDURE
А.5.1 Set the necessary frequency value by enabling one of the subranges with the switch MULTIPLIER-MHz and the knob FREQUENCY. The frequency value in the 20 Hz...200 kHz domain (1...4-й subranges) can be read on the upper scale times the corresponding multiplier, and in (0.2...2) MHz (5-й subrange) and (2...10) MHz (6-й subrange) domains - on the middle and lower scales respectively.
А.5.2 Connect the insturment under study to the "3V" generat oroutput, if the necessary output voltage value does not exceed 3.0 V, or to the "30V" output, in case it is over 3.0 V.
А.5.3 Set the necessary output voltage value in the staged attenuator and smoothly with the knob REG.OUT at the right-side position of the VOLTMETER toggle, in case the "3V" output is used, or only with the knob at the left-sided position of the VOLTMETER toggle, in case the "30V" output is used.
APPENDIX B
MULTI-PURPOSE DIGITAL VOLTMETER В7-28
B.1 APPLICATION
The multi-purpose digital voltmeter В7-28 is intended to measure dc and ac voltage, ac resistance, dc/dc voltage ratio, and ac/dc voltage ratio.
B.2 TECHNICAL SPECIFICATIONS
B.2.1 The voltmeter supports the dc voltage measurements of both positive and negative polarities within the ragne from 1 mcV up to 1000 V in the measuremet ranges such as 0.1; 1; 10; 100; 1000 V.
B.2.2 The voltmeter supports the ac voltage measurements within the range from 100 mcV up to 300 V at the measurement ranges such as 1; 10; 100; 300 V. The frequency range of the measurable voltage is from 20 Hz up to 100 kHz.
B.2.3 The basic relative dc voltage measurement error does not exceed the values, given in Table B.1.
Table B.1
|
Frequency range |
(20.60) Hz |
60 Hz ... 5 kHz |
(5…20)kHz |
(20...100) kHz |
|
The basic relative ac voltage measurement error is 8, % |
±(0.25+0,15UПР/UV) |
±(0.15+0.05UПР/UV) |
±(0.15+0.05UПР/UV) |
±(0.5+0.lUПР/UV ) |
UПР - the measurement limit at the input Нx of voltmeter V;
UV - voltmeter indication, V.measurement limits selection
B.2.4 The following voltmeter operaiton modes are available:
– manual measurement limits selection; automatic measurement limits selection;
– single start;
– periodic start.
B.2.5 The voltmeter input resistance at Нх input when measuring ac voltage is (1.1±0.2) МOhm at all the measurement limits. The input parallel capacitance does not exceed 50 pF, and with the input cable - 120 pF.
B.3 OPERATIONAL PRINCIPLE
The dc voltage measurement principle is based on the two-cycle integration principle. The resistance and ac voltage measurement principle is based on the conversion of the measurable quantities into proportional voltage with its further measurement using the two-cycle integration method.
Figure B.1 plots the block diagram of the multi-purpose digital voltmeter and its connection to the devices under study when measuring different parameters the funcitonal voltmeter units, used to impliment the selected measurement principles.
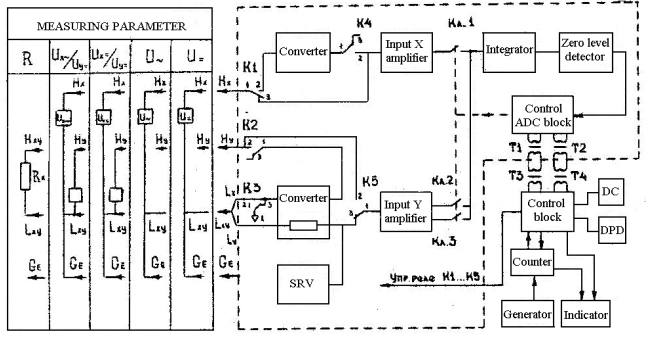
Figure B.1
The voltmeter is comprised of two parts: the analog and the digital ones.
The analog part is intended to convert the measurable dc voltage into its proportional time interval; to convert the measurable ac voltage and resistance into their proportional dc voltage; to detect the polarity of the measurable dc voltage; to transmit to the digital part the data on the value and polarity of the measurable dc voltage.
The digital part is intended to control the analog part; to obtain the visual readout of the measurable dc and ac voltages and resistance, dc/dc voltage ratio UХ=/Uy= and ac/dc voltage ratioUХ~/UУ=; to drive the measurement data to external printing device (CPU); ensure remote control (RC) of the voltmeter operation.
Figure B.1 illustrates the analog part inside the protective shield. The interconnection between the analog and digital parts is implemented through pulsed transformers Т1-Т4.
THe measurable dc votlage is connectable to the voltmeter with the clamps НХ and LХУ of the input cable. In the dc voltage measurement mode the relay К1-К5 is in position 3. The measurable voltage is supplied to the input X amplifier input. The output amplifier current X, proportional to the measurable dc voltage, is applied through the closed key Кл.1 to the integrator input, being in its initial (zero) state, and charges the integrator within the time interval Т0 (direct integration). As soon as the direct integration is over the input X amlifier output is disconnected from the integrator input and with the keys Кл.2 and.3 depending the polarity of the measurable voltage is connected to one of the input Y amlifier outputs.
The amplifier Y output reference current, porportional to the reference voltage U0, generated by the reference voltage source (RVS), discharges the integrator within the time interval ТХ (reverse integration).
The integrator is being discharged unless it returns to its initial (zero) state, which is fixed by the zero-level detector (ZLD).
The integration method can be described by the expression
TХ = T0U/U0,
where ТХ - is the reverse integration time; Т0 - direct integration time; U - measurable voltage value; U0 - reference voltage level.
The counter, when counts th enumber of the generator pulses during the time interval ТХ, makes it possible to obtain the indication
of the measurement result in the form of the pulse number.
IN the resistance measurement mode the relays К1 and К4 are switch to position 2. The measurable ac voltage is connectable with the clampls НХ and LХУ of the input cable to the converter input U~, where it is converted into its proportional dc voltage, which is in its turn being measured in the way described above.
IN the resistance measurement mode the relays К1, К4, and К5 are switched to position 3, relays К2 and КЗ - to position 2. In the dc/dc voltage measurement mode UХ= /UУ= the relays К1-К4 are in position 3, and relay К5 - in position 2. In the ac/dc voltage measurement mode UХ~/Uy= the relays Kl, K4, and K5 are in position 2, the relays К2 and КЗ - the relays 3.
B.4 PREPARARION OF THE INSTRUMENT FOR OPERATION
B.4.1 Switch on the toggle to the mains using the
connecting cord and set the POWER toggle to the position «ON» Warm the
instrument up during 2...3 min.
B.4.2 Set the measurement limits switch to the position «AUT» when working in the automatic measurement limits selection mode or to the position "1000 (~300)" when working in the manual measurement limits selection mode.
B.5
MEASUREMENT PROCEDURE
B.5.1 For ac voltage measurements set the kind of
operation switch to position "V~";
Set the measurement limits switch when operating in the manual measurement limits selection mode to the position corresponding to the measurable voltage value. When working in the automatic measurement limits selection mode:
– set the measurement limits switch to the position AUT;
– connect the clamp GE on the input cable to the clamp LХУ;
– присоедините зажимы НХ и LХУ входного кабеля к измеряемому объекту;
– read out the measurement result on the indicator display.
B.5.2 For dc voltage measurements set the kind of operation switch to the position "V=". In the remaining part the measurement procedure is similar to the one described in B.5.1.
The instrument's layout is shown in Figure B.2.
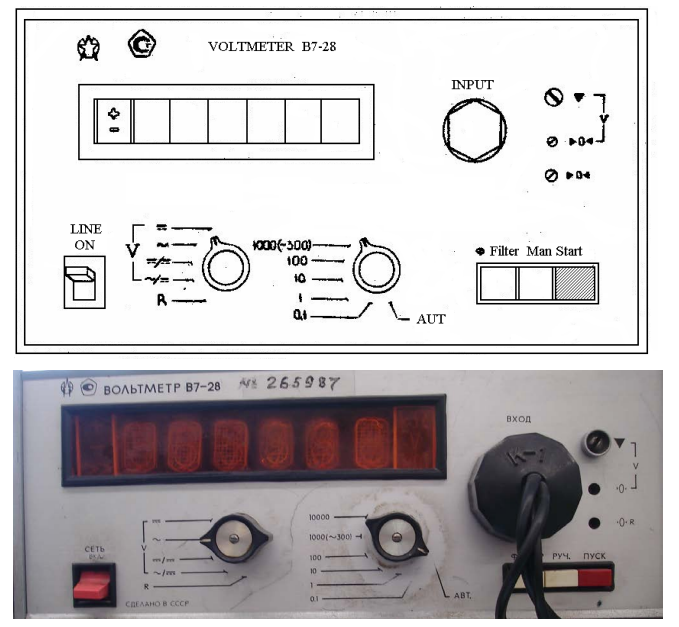
Figure B.2
APPENDIX C
MILLIVOLTMETER ВЗ-38
C.1 APPLICATION
Millivoltmeter ВЗ-38 is
intended to measure ac voltage.
C.2 TECHNICAL SPECIFICATIONS
C.2.1 The measurement limits: 1, 3, 10, 30, 100, 300 mV; 1, 3, 10, 30,
100 and 300 V.
C.2.2 The frequency range of measurable voltages: 20 Hz ... 5 MHz.
C.2.3 The basic reduced error of the instrument, expressed in percentage of the established measurement limit does not exceed ±2.5 % in the subranges (1...300) mV and ±4 % in the subranges (1...300) V for the frequency range 45 Hz ... 1 MHz.
C.2.4 The input resistnance is at least 5 MOhm at the measurement limits (1…300) mV and at leaset 4 MOhm at the measurement limits (1...300) V.
C.2.5 The input capacitance does not exceed 30 pF at the measurement limits (1...300) mV and does not exceed 15 pF at the measurement limits (1...300) V.
C.3 OPERATION PRINCIPLE
C.3.1 Millivoltmeter ВЗ-38 is
a direct-conversion digital analog voltmeter .
C.3.2 The millivoltmeter includes a half-period average value detector.
C.3.3 The instrument's scale is calibrated in rms vlaues of sine voltage.
C.3.4 The instrument's input is closed.
C.3.5 The block diagram of the millivoltmeter corresponds to Figure 2.2,b.
C.4 PREPARARION OF THE INSTRUMENT FOR OPERATION
C.4.1 Set the measurement limits switch to "30 V", enable power (MAINS toggle
in its uppter position), warm the instrument up during 2 … 3 min.
C.4.2 Supply the signal under study to the input of the instrument by connecting the input cord to the length of the electric circuit under study.
C.5 MEASUREMENT PROCEDURE
C.5.1 Match the instrument to the parameters of
the signal under study by setting the measurement limits switch to the position
that corresponds to the level of the measurable voltage (the indicator hand
must appear beyond the first third of the readout scale).
C.5.2 Measure UCB of the signal under study by reading UV indications of the instrument and calculating
 (C.1)
(C.1)
The layout of the instrument is given in Figure C.1.
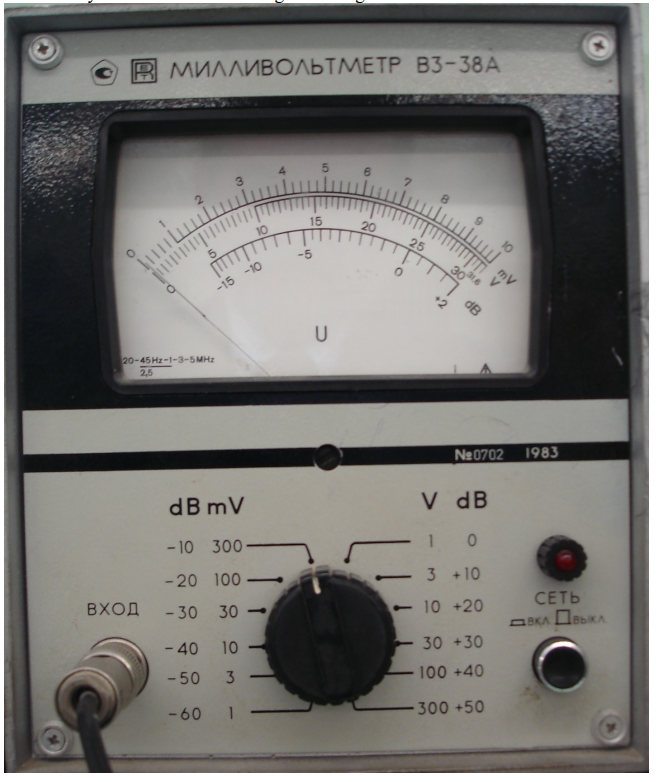
Figure C1
APPENDIX D
Microvoltmeter ВЗ-40
D.1 APPLICATION
Microvoltmeter ВЗ-40 is intended to measure the arbitrary waveform AC voltage.
D.2 TECHNICAL SPECIFICATIONS
D.2.1 THe measurement limits: 0,03; 0,1; 0,3; 1; 3; 10; 30; 100; 300 mV; 1; 3; 10; 30; 100; 300 V.
D.2.2 The frequency range of measurable voltages: 5 Hz ... 5 MHz.
D.2.3 The basic reduced error of the instrument, expressed in percentage of the established measurement limit does not exceed ±1.5 % at the limits (1...300) mV, ±2.5 % at the limits (0.1..0,3) mV, (1. .300) V, and ±4 % at the limit 0.03 mV in 45 Hz ... 1 MHz frequency range.
D.2.4 The input resistnance of the istrument is at least 2.5 MOhm.
D.2.5 The input capacitance does not exceed 30 pF at the limits (0.3...300)mV and 15 pF at the limits (1...300) V.
D.3 OPERATION PRINCIPLE
D.3.1 Microvoltmeter ВЗ-40 is a direct-conversion digital analog voltmeter.
D.3.2 The microvoltmeter has a root-mean square value detector.
D.3.3 The instrument's scale is calibrated in root-mean square values of arbitrary waveform voltage.
D.3.4 The instrument's input is closed.
D.3.5 The block diagram of the microvoltmeter corresponds to Figure 2.2,b.
D.4 PREPARARION OF THE INSTRUMENT FOR OPERATION
D.4.1 Set the measurement limits switch to the position "300 V", enable power (the MAINS toggle is in its upper position), warm the instrument during 2...3 min., with the knob "0" set the hand of the instrument to the crosshatched sector of the scale.
D.4.2 Supply the signal under study to the instrument input by connecting the input cord to the length of the electric circuit under study.
D.5 MEASUREMENT PROCEDURE
D.5.1 Match the instrument to the parameters of the signal under study by setting the measurement limits switch to the position that corresponds to the measurable voltage level (the indicator hand must appear beyond the first third of the readout scale).
D.5.2 Measure UСК of the signal under study by reading the instrument's indications.
 (D.1)
(D.1)
The instrument's layout is shown in Figure D.1.
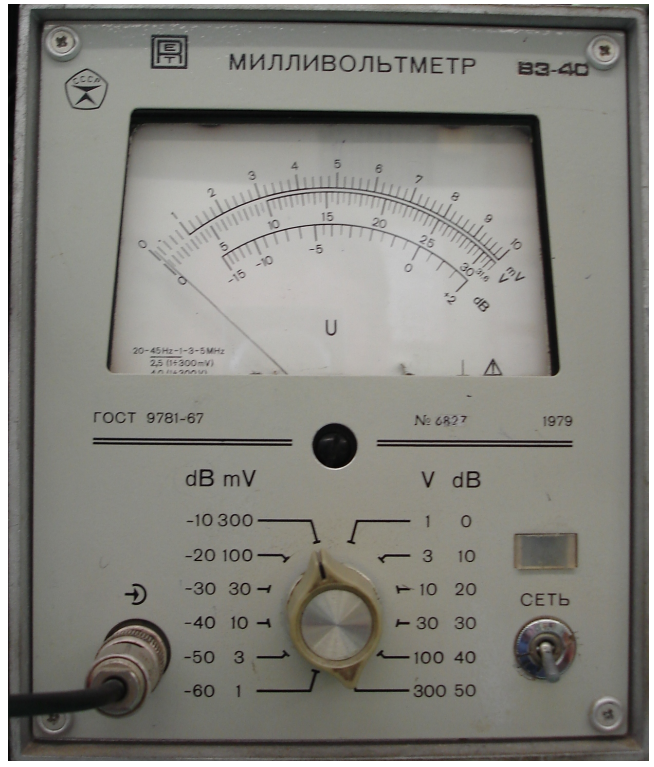
Figure D.1
APPENDIX E
PULSE CURRENT MILLIVOLTMETER В4-12
E1. APPLICATION
Millivoltmeter В4-12 is intended to measure the amplitude values of rectangular video pulses of positive and negative polarities, countable from the line of the average value, as well as sine voltage amplitudes.
E.2 TECHNICAL SPECIFICATIONS
E.2.1 The measurable voltage limits: 3, 10, 30, 100, 300, 1000 mV.
E.2.2 The basic reduced error, expressed in percentage of the end value of the operated part of the scale does not exceed ±4 % when measuring the amplitude of videopulses of 0.4 up to 300 mcs in width and sine voltage amplitudes in the frequency domain from 500 Hz up to 1 MHz, as well as does not exceed ±6 % when measuring pulses of 0.1 up to 0.4 mcs in width and sine voltage amplitudes in the expanded frequency domain over 1 MHz up to 5 MHz.
E.2.3 The input resistnance of the instrument is at least 1 MOhm, the insput capacitance does not exceed 10 pF.
E.3 OPERATION PRINCIPLE
The block diagram of millivoltmeter В4-12 corresponds to Figure 2.2,b. The millivoltmeter
includes the peak value detector, its scale is calibrated in peak values of voltage. The peak detector is designed
according to the self-compensation circuitry, illustrated in Figure E.1,а. The operation principle of the
detector is explained with time diagrams, shown in Figure E.1,b.

Figure E.1
As soon as the measurable pulse arrives, one of the capacitors in the pulse generator is charged. When the pulse is finished, this capacitor is slowly discharging through the resistor, ensuring that extended pulses, the width of which is determined by the input pulse amplitude, would appear at the output of the pulse generator. The pulses are amplified by the amplifier up to the level when their constant component appears equal to the input pulse amplitude. The gain is controlled by the signal at the comparison circuit output. The generator of the compensatory voltage generates the dc voltage, equal to the constant component of the pulsed signal at its input.
E.4 PREPARARION OF THE INSTRUMENT FOR OPERATION
E.4.1 Set the maximal measurement limit
of 1000 mV, enable the power of the instrument (the MAINS toggle is in its
upper position), warm the instrument up during 2...3 minutes, set the electric
zero on the instrument (by rotating the pressed knob BALANCE).
E.4.2 Supply the signal under study to the instrument's input by connecting the input cord to the length of the electric circuit under study.
E.5 MEASUREMENT PROCEDURE
E.5.1 Match the instruments to the
parameters of the signal under study by setting the switches KIND of WORK and POLARITY to the positions that
correspond to the waveform, width and
polarity (in case of pulsed signals) of the signal under study, then set
the switch «MEASUREMENT LIM. mV» to the position that corresponds to the level
of the signal under study (the instrument's hand must stay beyond the first
third of the readout scale).
E.5.2 Measure the amplitude value Um of the variable component of the signal under study by reading the instrument's indications:
 (E.1)
(E.1)
The instrument's layout is shown in Figure E.2.

Figure E.2
APPENDIX F
MULTI-PURPOSE OSCILLOSCOPE С1-72
F.1 APPLICATION
F.1.1 Oscilloscope С1-72 is intended to visually observe of the voltage variations of electric signals in time, as well as to measure their amplitude and time parameters.
F.1.2 When doing this Laboratory work oscilloscope С1-72 should be used only for visual observation of electric signals.
F.2 TECHNICAL SPECIFICATIONS
F.2.1 The functional part of the screen is no more than 40 mm vertically and 80 mm horizontally.
F.2.2 THe passband of the vertical deviation channel is equal:
– in case of open input dc up to 10MHz;
– in case of closed input - 5 Hz up to 10MHz.
F.2.3 The maximal sensitivity of the vertical deviation channel is 0.3 mm/mV. The maximal amplitide of the signal under study is 60 V.
F.2.4 The beam deviation vertical coefficient has been calobrated and can be set in steps from 20 mV/div up to 10 V/div (0.02; 0.05; 0.1; 0.2; 0.5; 1; 2; 5; 10 V/div).
F.2.5 The oscilloscope can be operated in the continuous and slave sweep modes, as well as in the external-signal sweep mode.
F.2.6 The sweep generator sync is provided with the signal under study (internal sync), external sine or pulsed frequency from 5 Hz up to 10 MHz, adn the amplitude from 0.3 up to 3 V (external sync), as well as by the mains voltage.
F.2.7 The range of the calibrated sweep lengths is from 50 ms/div up to 0.05 mcs/div (50; 20; 10; 5; 2; 1; 0.5; 0.2; 0.1 ms/div; 50; 20; 10; 5; 2; 1; 0.5; 0.2; 0.1; 0.05 mcs/div).
F.3 OPERATION PRINCIPLE
The instrument С1is a typical multi-purpose electron-beam oscilloscope. The operation principles of the electron-beam oscilloscopes are considered in the guideline instructions for the Laboratory work Э4.Б.
F.4 PREPARARION OF THE INSTRUMENT FOR OPERATION
F.4.1 Press the POWER button, connect the plug of the power cord to the power supply mains, set the knobs "Θ" (beam focus), "*" (beam brightness) into midposition, set the knob STABILITY into its extreme right-side position (continuous sweep generation), set the knob TIME/DIVIS to the position "0.1 mS", release the button INPUT X, set the knob on the switch VOLT/DIVIS to the position "10".
F.4.2 Enable the power of the instrument (the POWER button is pressed), warm the instrument up during 2...3 min., set in the middle of the screen a clear horizontal line, using the knobs "↕", "↔", "Θ" and "*", connect the cable to the plughole INPUT Y.
F.4.3 S Supply the signal under study to the instrument input by connecting the input cord to the length of the electric circuit under study.
F.5 MEASUREMENT PROCEDURE
Match the instrument to the parameters of the signal under study by
selecting the input (the key "≈" is released - closed input), select
the attenuation Y for the channel (by the knob of the switch VOLT/DIVIS. in the
position when a bright horizontal line occupies the largest part of the screen,
without going beyond its limits) select the sweep generator start (internal
sync - pressed button; select the parameters of the sweeping signal (the knob
«TIME/DIVIS», is in the position when the image of 2 - 3 periods of the signal
under study are slowly moving on the screen ), make sure that the signal is not
moving (the LEVEL knob is
in its extreme left-side position, abd the STABILITY knob - in the position,
when the image on the screen is vanishing, then turn the LEVEL knob to the
right untill a stable image of the signal under study appears on the screen).
The instrument's layout is shown in Figure F.1.

Figure F.1
APPENDIX H
CIRCUIT NOISE METER 12XN047
H.1 APPLICATION
Circuit noise meter 12XN047 is intended to measure psopometric levels and voltages in telephone and radio broadcusting circuits and in the circuits with linear freqeuncy responses .
H.2 TECHNICAL SPECIFICATIONS
H.2.1 The measurement limits of psophometric levels and voltages:
– in the telephony bandpass - minus 90 dB ... +12 dB (30 mcV ... 3 V);
– in the telephony bandpass - minus 80 dB ... +22 dB (100 mcV ... 10 V);
H.2.2 Frequency range 20 Hz ... 20 kHz.
H.2.3 The basic measurement error ±2 %.
H.2.4 Auxiliary error, induced by the divider in the frequency range 20 Hz ... 20 kHz, is ±5 %.
H.2.5 The input resistance of the symmetric input 600 Ohm ± 2 %, is short-circuited with respect to the case of the symmetric input at the frequency 800 Hz-200 kOhm.
H.2.6 The input resistance of assymetric input 600 Ohm ± 2 % and 100 kOhm/150 pF.
H.3
OPERATION PRINCIPLE
The block diagram of the instrument is given in Figure H.1

Figure H.1
The input device has a symmetric input, that ensures suppression of the longitudinal (sinphase) interference by at least 100 dB. In order to ensure the matched connection to the measurable circuit a high-ohmic input is loaded with a resistor (600 Ohm in resistance), which is connected with key 1. The attenuator "Аtt" makes it possible to introduce attenuation up to 90 dB in 10 dB steps. After the first attenuator and intermediate attenuator 1 sections it is possible to optionally include the psophometric broadcasting filter F1 or telephony filter F2, or include a resistor in order to introduce equivalent attenuation, if the circuit noise meter is used as a voltmeter. The rms value detector, included after the output amplifier Amp2, support summation of the frequency components of the signals with amplitudes 3-4 times higher than the effective value. The required value of the time constant is provided by the use of a microammeter with lightweight moving system as an indicating device. The layout of the instrument's front panel is shown in Figure H.2.

Figure H.2
H.4 PREPARARION OF THE INSTRUMENT FOR OPERATION
H.4.1 Learn the locations and applications of the controls, located on the instrument's front panel.
H.4.2 Set the POWER toggle into its low position and connect the power cord and connection cord (to the plugholes INPUT SIMM.).
H.4.3 Set the the measurement limits switch to the position «0 dB».
H.4.4 Enable the instrument and warm it up during 2 ... 3 min.
H.4.5 Set the measurement limits switch to the positon «ZERO SET» and set with the potentiometer ZERO SETthe instrument's hand to zero mark of the mV scale.
H.4.6 Set the operation mode switch to the position «SET», set the measurement limits switch to the position «SET» and set the instrument's hand to the calibration hair (under the scale in dB).
H.5 MEASUREMENT PROCEDURE
H.5.1
Set the measurement limits switch to its right-sided position "+10
dB" and supply the measurable signla to the input clamps.
H.5.2 Set the operation mode switch to the position to one of the positions RADIO, TELEPHONE, LIN. depending on the measurement mode.
H.5.3 Set switch «200 ms – 1 s» to the position that corresponds the the required time constant. For precise detection of the psophometric voltages, containing the pulses, the circuit with a low time constant should be set. In order to measure integral values select the time constant of 1s.
H.5.4 Using the switch «600 Ohm - 20 kOhm» set the input resistance of the instrument to «600 Ohm».
H.5.5 Turning the measurement limits switch anti-clockwise achieve maximal deviation of the hand on the instrument's scale.
H.5.6 The measured value is determined by additing the readings of the pointer instrument and position of the measurement limits switch. When the operation modes switch is in the position «LIN.», «TELEPHONE», «EXTNL. FILTER" read the black numbers of the measurement limits switch, and in the «RADIO» position – red numbers.