
Laboratory work #2 "Measurement of frequency and time parameters with a digital frequency meter"
1 Purpose of work
1.1 The study of digital methods for measuring the frequency and period of electrical signals.
1.2 Study of digital methods for measuring pulse duration and frequency ratio.
1.3 Studying the Ch3-63 frequency meter and acquiring practical skills in working with it.
2 Brief information from the theory
The main time-frequency parameters of electrical signals are period-T, frequency f, pulse duration τ.
Period - the smallest time interval through which the instantaneous values of the signal U(t)=U(t+T) are repeated for any arbitrary time t.
Frequency - is defined as the number of identical events (for example, periods) per unit of time, i.e. this is the reciprocal of the period f=1/T.
Pulse duration - an interval of time during which the instantaneous values of the pulse signal do not exceed the level of 0.5 of the amplitude value.
In addition to the above parameters, pulse signals are sometimes characterized by a duty cycle, which is determined by the ratio Q=T/τ.
Instruments for measuring frequency and time form a subgroup and, and for measuring only time intervals - a subgroup I. A sufficiently detailed classification of methods for measuring frequency and time is given. Within the framework of this work, only the most common method is studied - electronic counting digital. Devices that implement this method (type Ch3) have a very high accuracy and, at the same time, are compact, reliable, technologically advanced and easy to operate. Due to the fact that when measuring various time-frequency parameters by this method, the same type of electronic units are required, Ch3 devices are universal and usually allow measuring several quantities. Digital frequency counters are usually very broadband. Their frequency range "up" is limited only by the speed of the element base.
The principle of operation of a digital frequency counter is based on the definition of frequency given earlier. The block diagram that implements this principle is shown in Figure 1, and the timing diagrams explaining its operation are shown in Figure 2.
The signal U(t), the frequency of which is measured, is fed through the input device to the forming device, where it is converted into pulses (diagram U1, Figure 2) with the same frequency. The amplitude of these pulses does not depend on the amplitude and shape of the input signal.
In the block of reference frequencies (FRB) a signal is formed with a period equal to one time and corresponding to the time of measurement of the Tm (diagram U2). Due to the fact that Tm is a measure of time, the accuracy of measurements will depend on its accuracy and stability. Therefore, the FRB consists of a highly stable quartz oscillator (OQ) and a system of frequency dividers (DF).
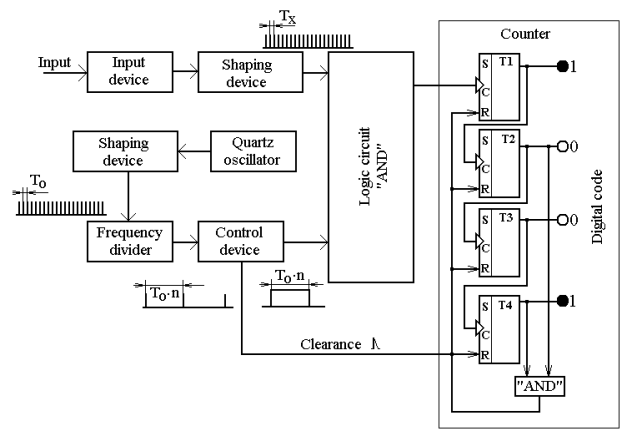
Figure 1 – Structural diagram of a digital frequency meter
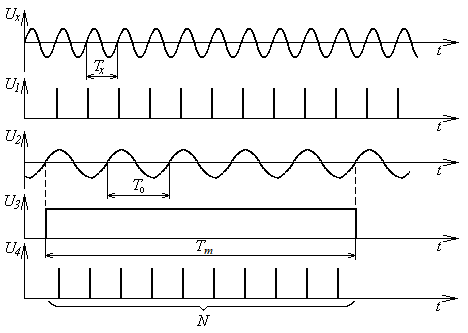
Figure 2 – Timing diagrams explaining the principle of measuring frequency
The control device generates from the FRB signal an impulse with the duration of the Tm (diagram U3), which opens the time selector (TS). TS is an electronic key, upon opening of which pulses from the shaping device (SD) are sent to the pulse counter (PC) (plot 4). Since before the measurement, the midrange is set to "zero", then at the end of the Tm interval it will receive N pulses, where
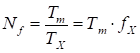 (1)
(1)
Therefore, Nf is directly proportional to fx. For example, with Tm = 1 s, Nf =1 will correspond to a frequency of 1 Hz. The state of the PC is indicated in decimal form by a reading device (RD). The capacitance of the counter limits the maximum measurable frequency value, i.e. defines the measurement limit. You can change it by setting Tm = 10m sec, where m = 2, 1, 0, -1, -2, ... In this case, the correct reading will be provided by transferring the decimal point to the RD display, which is equivalent to multiplying or dividing by 10. Schematically, this is realized by changing the division factor of the DF in the FRB.
Sources of error are the instability of the OQ frequency and the discreteness error. The discretization error is due to the fact that the counter counts only an integer number of pulses, and therefore equality (1) is valid up to an integer. The maximum absolute error in this case does not exceed one pulse. Relative 1/N. Resulting relative error
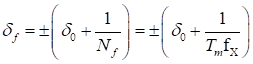 (2)
(2)
where δ0 is the relative
frequency instability of the quartz oscillator.
As follows from formula (2), as fx increases, the discreteness error tends to zero. Therefore, when measuring high frequencies, the first component of the error prevails, and at low frequencies, the second. In addition, it can be seen that one of the ways to reduce the measurement error of low and infra-low is often to increase the measurement time Tm. However, when Tm > 1s, the operator is forced to wait for a result for a long time, which creates non-convenience in work. Other ways to reduce the discretization error include multiplying the Frequency of the input signal and using an electronic vernier (vernier method). The first of these methods is technically difficult to implement at low frequencies, and the second is widely used by frequency counter developers. Most often in practice, the transition from frequency measurement to period measurement is used.
Indeed, from formula (1) it can be seen that the number of pulses received by the counter is directly proportional to the selector opening time. Therefore, opening the TS for the time of the measured period Tx and using pulses of known frequency fo for counting, we obtain N corresponding to the unknown period. This algorithm is implemented by a block diagram (Figure 3), and its operation is explained by timing diagrams (Figure 4).
The signal U(t) with the period TX is converted into pulses with the same period, into the SD (diagram 1) and enters the DF with a division factor of 10n (n = 0, 1, 2,...), which is selected by the operator ( timing diagrams are shown for n = 0).
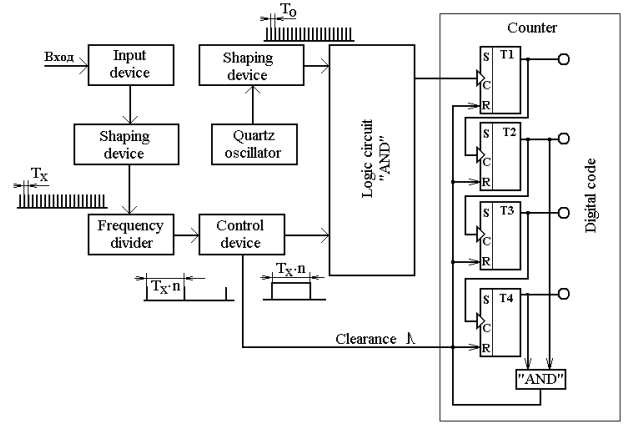
Figure 3
An impulse is formed in the CD (diagram 2), which opens the selector for a time TX10n. Pulses with a period of T0 are generated in the FRB, which, through a system of dividers and frequency multipliers (MDF) with a conversion factor of 10m (m = –1, 0, 1, 2, ...) (diagram 3) are fed through the TS on the PC (plot 4).
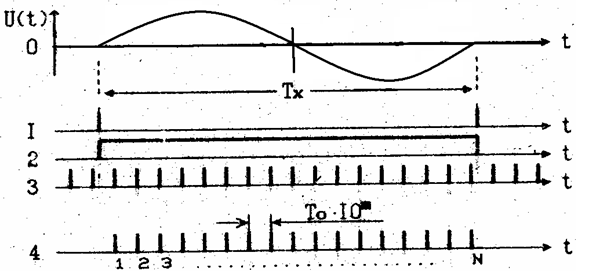
Figure 4
Their number
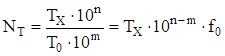 (3)
(3)
proportional to the period being measured. At f0 = 10 MHz, Nt with a coefficient of 10n-m-7 is equal to the period in seconds. The reading in ms or µs is obtained by moving the decimal point to the RD.
Sources of error are similar to frequency measurements. At low frequencies (ТХ is large enough) the discretization error tends to "zero" and the error dominates due to the instability of the period Т0. At high frequencies (TX is small), δo becomes negligible. Therefore, the measurement accuracy can be improved by decreasing the period T0 (m = -1) or measuring not one, but n signal periods (n > 0) with subsequent averaging. In addition, the discretization error can be reduced by using an electronic vernier.
Measuring the pulse duration is almost the same as measuring the period (both quantities are time intervals). at n ≠ 0, the signal after the DF will have a duration that is not related to the measured one. The number of counting pulses received by the counter will then be
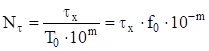 (4)
(4)
Sources of error are evaluated similarly to the period measurement. However, it should be noted that with the duration of the front and cutoff of the measured pulse comparable to fo, an additional error appears.
To measure the frequency ratio, you can use the scheme of Figure 1 with slight modifications. Indeed, if pulses with a higher frequency f1 are applied to point 1 of the circuit, and pulses with a lower f2 are applied to point 2, then, as it follows from formula (1), the number of pulses received at the PC will be
 (5)
(5)
those N equal to the ratio of frequencies.
3 Instruments used in the performance of work
3.1 Electronic counting frequency meter Ch3-63 or ChZ-63/1.
3.2 Laboratory layout.
4 Description of the laboratory layout
The laboratory layout is designed to generate pulsed TTL signals. The layout is shown in Figure 5. The layout has two outputs "EXIT 0" and "EXIT 1", switches OPTION, POINT NUMBER, MODE, a mains switch and an indicator of turning on the network NETWORK.
The OPTION switch is designed to set the task variant in accordance with the team number. The POINT NUMBER switch has 4 positions and is designed to select the measurement object. With the help of the MODE switch, the type of measured value is selected. The first position "f, T" corresponds to the measurement of frequency and period, the second "τ, T, Q" - to the measurement of pulse duration and indirect measurements of the duty cycle, the third "fo / f1" - to the frequency ratio measurement mode. The main working output of the layout is "OUT.0", which has an output signal in all modes of the layout. The output "OUT.0" is intended only for measuring the ratio of frequencies. In this case, a digital frequency divider is included between the layout outputs. Higher frequency on "OUT0". The power supply of the layout is turned on by the NETWORK toggle switch.

Figure 5
5 Preparing for work
5.1 According to the recommended literature and these guidelines, study the principle of operation of an electronic counting frequency meter and its operation in the modes of measuring various parameters.
5.2 According to Appendix A of these guidelines, study the frequency meter Ch3-63 (ChZ-63/1), its technical characteristics, measurements with its help and assessment of instrumental error.
5.3 Make a draft report (one per team) in accordance with the requirements of the "Contents of the report" section of these guidelines and the laboratory task.
5.4 Answer security questions.
5.5 Derive formulas for estimating the absolute and relative errors of indirect measurements of duty cycle.
6 Laboratory task
6.1 Measure the frequencies and periods of electrical signals.
6.2 Analyze the influence of the operating modes of the frequency meter and the values of the measured frequencies and periods on the measurement error.
6.3 Measure the duration, repetition periods of pulses and determine their duty cycle.
6.4 Measure the frequency ratio.
7 Work order
7 Perform measurements in accordance with 6.1 of the laboratory task. Measurements are carried out in the following sequence.
7.1.1 Prepare the Ch3-63 frequency meter for operation in accordance with Appendix A of these guidelines.
7.1.2 Set layout switches:
- OPTION in the position of the brigade number;
– MODE - to position "f, T";
- POINT NUMBER - to position "1" and turn on the layout.
7.1.3 Measure the signal frequencies fx at the output "OUT.1" of the layout for all four points using CHZ-63 (5.2 Appendix A). Record the measurement results in Table 1, recording the measurement time in it.
7.1.4 Repeat measurements fx, increasing the measurement time by 10 times. Also include the results in Table 1. Estimate the instrumental measurement error in absolute and relative form.
Table 1
|
Point No. |
Тm = 0,1 с |
Тm = 1,0 с |
||||
|
fx, kHz |
δf, % |
Δf, kHz |
fx, kHz |
δf, % |
Δf, kHz |
|
|
1 2 3 4 |
|
|
|
|
|
|
7.1.5 Measure the periods of the same signals Tx for all points using the Ch3-63 frequency meter (5.3 Appendix A). Measurements should be carried out for one period with the same period of time stamps for all points. Record the results in table 2, fixing in it the period of time stamps T0.
7.1.6 Repeat measurements according to 7.1.5, increasing the period of time marks by 10 times.
7.1.7 Repeat the measurements according to 7.1.5 and 7.1.6 by measuring 10 periods Tx (multiplier 101). Record the measurement results in Table 2.
7.1.8. Estimate instrumental measurement errors for all Tx measurement modes.
7.2. Analyze the results obtained in 7.1.
Table 2
|
Point No. |
To = µs, n = 1 |
To = µs, n = 1 |
||||
|
Tx, ms |
δТ, % |
Δт, µs |
Tx, ms |
δТ, % |
Δт, µs |
|
|
1 2 3 4 |
|
|
|
|
|
|
|
Point No. |
To = µs, n = 10 |
To = µs, n = 10 |
||||
|
Tx, ms |
δТ, % |
Δт, µs |
Tx, ms |
δТ, % |
Δт, µs |
|
|
1 2 3 4 |
|
|
|
|
|
|
7.2.1 To trace the influence of the value of the measured frequency on the instrumental component of the error at different measurement times.
7.2.2 Determine the dependence of the value of the measured period on the instrumental component of the error for a different period of time stamps and for a different number of measured periods.
7.2.3 Compare measurement errors of frequency and period of the same signal. Draw conclusions. The results of the analysis should be included in the report.
7.3. Perform measurements in accordance with 6.3 of the laboratory task. Measurements are carried out in the following sequence.
7.3.1 Set - layout switches:
– POINT NUMBER to position “1”;
- MODE - to the position "T, τ, Q".
7.3.2 Measure the period of the signal T with an accuracy of 5 significant figures and evaluate the measurement error.
7.3.3 Measure the pulse duration τx for all four points (Appendix A.5.4) and evaluate the instrumental component of the measurement error in absolute and relative form. Record the results in table 3.
7.3.4 Determine the duty cycle of the pulses Qx and evaluate the error of their measurement in absolute and relative form as the error of indirect measurements with single observations. Record the results in table 3.
Table 3
|
Point No. |
T = µs, δТ = %, ΔТ = µs |
|||||
|
Tx, ms |
δQ, % |
Δτ, µs |
Qx |
δQ, % |
ΔQ |
|
|
1 2 3 4 |
|
|
|
|
|
|
7.4 Perform measurements in accordance with 6.4 of the laboratory task. Measurements are carried out in the following sequence.
7.4.1 Set the layout MODE switch to “f0/f1”.
7.4.2 Measure the frequency ratio at the first point, guided by 5.5 of Appendix A. Record the measurement result in Table 4, indicating the position of the frequency meter MULTIPLE switch.
7.4.3 Repeat measurements for other points.
7.4.3 Estimate instrumental measurement errors.
Table 4
|
Point No. |
N = |
|||
|
1 |
2 |
3 |
4 |
|
|
f0/f1 |
|
|
|
|
|
δ |
|
|
|
|
7.5 Coordinate with the teacher the results of the experiments and if there are no comments, disconnect the device and the layout from the network. Proceed to the preparation of the report.
8 CONTENT OF THE REPORT
8.1 The report should contain the statement of the purpose of the work, the laboratory task, the main technical characteristics of the frequency meter in the form of Table 5, a simplified structural diagram of the device, the main calculation formulas, the results of calculations and experiments, an estimate of errors and conclusions for each item of the task.
Table 5
|
Device name |
Type |
Serial number |
Main technical data |
|
Electronic counting frequency meter |
Ch3-63 (Ch3-63/1) |
|
|
8.2 The column "Basic technical characteristics" should include the information necessary for the performance of work, calculations, evaluation of errors and conclusions.
8.3 The results of measurements and calculations should be given in the form of tables recommended in these guidelines.
8.4 The report must comply with the system of ESKD standards.
9 CONTROL QUESTIONS
1 List the main methods for measuring the frequency and time parameters of signals.
2 What is the essence of the electronic counting method for measuring frequency, period, pulse duration, frequency ratio?
3 List the main sources of error in measuring frequency, period, pulse duration and frequency ratio by the digital method. What formulas can be used to estimate each of the error components of these quantities?
4 How do the error components change depending on the value of the measured parameter and the operating modes of the frequency meter?
5 What are the ways to improve the accuracy of measuring the frequency and period of HF and LF signals? What is the essence of each method?
6 How are the errors of indirect measurements with single observations estimated?
APPENDIX A
Electronic
counting frequency meter Ch3-63
A.1 PURPOSE
Electronic counting frequency meter Ch3-63 is designed for:
- to measure the frequency of sinusoidal and pulse repetition rates;
- measurements of the period of sinusoidal and the repetition period of pulsed signals;
– measurement of pulse duration;
– measurements of the frequency ratio of electrical signals;
– counting the number of electrical signals;
– issuing a reference frequency signal;
– issuing information about the measurement results to the recording device.
A.2 MAIN TECHNICAL CHARACTERISTICS
A.2.1. The range of measured frequencies at input A in the range of 0.1 Hz to 200 MHz at an input signal voltage of up to 10 V.
A.2.2 The relative frequency measurement error δf does not exceed the values
where δ0 is the relative frequency instability of the reference oscillator;
fx - measured frequency in Hz;
Tm - counting time (measurement time) in seconds.
A.2.3 Relative frequency instability is not more than 5·10-7, after the settling time is 2 hours. Ready time with relative frequency instability ±5·10-5 does not exceed 1 min under normal conditions.
A.2.4 The area of measured single and averaged periods at input B in the range from 0.1 μs to 104 s (10 MHz ... 10-4 Hz) at an input signal voltage of up to 10 V.
Number of averaged periods (period multiplier) 10, 102, 103, 104. Clock period (time stamps) 10-7, 10-6, 10-5, I0-4 s.
А.2.5 Relative measurement error of periods of pulse signals δт with a rise time of not more than half of the period Т0 of the clock frequency signal does not exceed the values
where Tx is the measured period;
n is the number of averaged periods (period multiplier).
A.2.6 The frequency meter measures the duration of pulses of any polarity at input B from 0.1 µs to 104 s at a repetition rate of not more than 5 MHz and an input voltage of up to 10 V.
A.2.7 Relative measurement error of the pulse duration δτ with a total rise and fall duration of not more than half the period To of the clock frequency signal does not exceed the values

where Tx is the duration of the measured pulse.
A.2.8 The frequency meter measures the ratio of the frequencies of the signals applied to inputs A (highest frequency) and B (lowest). The frequency range in this case: the highest - 0.1 Hz ... 200 MHz, the lowest - 0.01 Hz ... 10 MHz.
A.2.9. The error in measuring the ratio of frequencies of pulse signals does not exceed the values
where fl and fh – the lowest and highest of the frequencies;
n – low frequency signal period multiplier (input B).
A.2.10 The frequency meter measures the frequency of its own reference signals (in self-control mode) 1; 10; 100 kHz, 1; 10 MHz to test performance.
A.2.11 The frequency meter provides a direct reading of the result in digital form with blanking of insignificant zeros, indication of units of measure, decimal point and overflow of the digital display.
In the "with memory" mode, the instrument stores the result for the next measurement cycle, and in the "summation" mode, it indicates a set of information during the measurement.
A.2.12 With automatic start, the possibility of smooth adjustment of the indication time of 0.1 ... 5.0 s is provided. Counting time when measuring frequency at input A 1, 10, 102, 103, 104 ms. The counting time with the intention of the period is defined as n-Tx.
A.2.13 The device has automatic, manual and external start, as well as the possibility of software remote control.
A.2.14 Input impedance and input capacitance 1 M0m and 50 pF at inputs A and B (input C is not used in operation). There is a possibility of setting the input resistance at the input A - 50 0m.
A.2.15 The device allows continuous operation under operating conditions for at least 16 hours.
A.3 PRINCIPLE OF OPERATION AND DESIGN OF THE INSTRUMENT
A.3.1 Principle of operation
The principle of operation of the electronic counting frequency meter is based on the counter counting the pulses received at its input during a certain time interval.
When measuring the frequency, pulses are considered that are formed from the measured signal over time, a strobe pulse, the duration of which is set by the reference frequencies.
When measuring the pulse duration and period, the number of pulses of the reference frequency (duty frequency or time stamps) is counted during the strobe pulse, the duration of which, when measured τ, is equal to the duration of the measured pulse.
A simplified structural diagram of the Ch3-63 frequency meter is shown in Figure A.1.
Figure A.1
In general, the block diagram of the frequency meter corresponds to the generalized block diagram of the universal frequency meter, considered in the literature.
The frequency meter has three inputs A, B, C, designed to supply measured signals when measuring, respectively, the frequency up to 200 MHz (In.A), the period and duration (In.B) and the frequency up to 1 GHz (In.C).
The frequency meter includes: input (ID) and form (FD) devices, a system of frequency dividers (DF, decade block DF1, block DF2), strobe trigger, time selector (TS), pulse counter (PC), counting device (CD), control circuit, multiplexers and block of reference frequencies. The latter, in turn, consists of a quarts oscillator (OQ) 5 MHz, multiplier and frequency divider and a multiplexer.
ID1 and ID2 consist of an attenuator and an amplifier and are designed to attenuate or amplify the measured signal to the level necessary for the normal operation of the FD. ID3 additionally contains an amplifier-limiter.
ID1 and ID2 carry out the formation of pulses with the frequency of the input signal, if it is sinusoidal, or improve the fronts and limit the amplitude with a pulsed form.
Multiplexers are multi-channel digital switches, the state of which is determined by a digital code on the control inputs. The presence of multiplexers allows you to select the operating mode of the frequency meter either using the mechanical switches of the device, or remotely using electrical signals.
The strobe trigger generates an impulse that opens the TS for the duration of the measurement.
The control circuit is intended for pre-installation, rewriting information on the RD, and also sets indications and controls the entire measurement cycle.
The purpose of the remaining nodes of the frequency meter is similar to that described in section 2 of these guidelines.
A.3.2 Location and purpose of controls
A.3.2.1. Controls, indications and connecting connectors are located on the front (Figure A.2) and rear panels, and are provided with appropriate inscriptions.

Figure A.2
A.3.2.2. On the front panel are located:
- toggle switch NETWORK, designed to turn on the power;
- push-button switch TYPE OF WORK, designed to select the type of measurement:
- switch COUNTING TIME ms/MULT, designed to select the counting time when measuring the frequency and selecting the averaging coefficient when measuring the period and frequency ratio;
– TIME STAMP switch, s. designed to select time marks (filling frequencies) when measuring the pulse duration and to select own reference frequencies in the self-control mode;
- potentiometer TIME IND, designed to set the desired time for displaying information on the digital display of the device;
– button "*/SUM" (in the on state - summation), designed to turn on and off the memory system, and in the summation mode to determine the beginning and end of the count;
- button "START", designed for manual start;
- "START BHESH" button, designed for internal automatic or external start (when pressed) of the device;
A.3.2.3 In the area of the channel B controls:
– LEVEL potentiometer, designed to select the trigger level for input B;
- switch "~/-", designed to set a closed or open input;
- switch "1:1/1:10", designed to attenuate the input signal:
- switch « / » is used to select the polarity;
- connector B, intended for signaling.
A.3.2.4 In the area of channel A controls:
– LEVEL potentiometer, “1:1/1:10”, “~/–” switches, connector perform functions similar to the corresponding organs of channel B;
– “1MΩ/50Ω” switch intended for setting the input impedance of channel A;
- switch "m / l", designed to select the bandwidth of the channel.
A.3.2.5 Switch "A-B" in the control zone of channel B, designed to select a low- or high-frequency channel when measuring frequency.
A.3.2.6 Controls and connections located on the rear panel are not used in operation.
A.4 PREPARATION FOR WORK
A.4.1 Turn off the START button EXT.
A.4.2 Set the NETWORK toggle switch to the lower position, plug in the power cord and turn the NETWORK toggle switch to the upper position. At the same time, one or more digital indicators should light up.
A.4.3 Warm up the device.
A.5 MEASUREMENTS
A.5.1 Performance check.
A.5.1.1 The instrument's operability is checked in the self-control mode.
A.5.1.2 Turn on button A (control) of the switch TYPE OF OPERATION.
A.5.1.3 Set the IND TIME knob to a position convenient for counting.
A.5.1.4 Make a reading from the digital display of the device, which must be a multiple of 10n, where n=0, 1, 2,..., depending on the positions of the switches "COUNTING TIME ms/MULTIPLE" and "TIME STAMP, s".
A.5.1.5 Press the START button, the counting should stop and the number 8 should be displayed in all digits of the display. When the button is released, the automatic cycle of operation should be repeated.
A.5.2 Frequency measurement on input A.
A.5.2.1 Press the "f" (frequency) button of the OPERATION switch.
A.5.2.2 Set the input switch "A-B" to position A.
A.5.2.3 Set the switch "COUNTING TIME ms/MULTIPLE" to the position corresponding to the required measurement accuracy. It is recommended that when measuring frequencies of 0.1-10 Hz, select position 104, frequencies of 100 Hz - 1 MHz - position - I03, and frequencies above 10 MHz - I01 or 100.
A.5.2.4 When measuring frequencies below 1 MHz, set the “M / L” switch to the “l” position.
A.5.2.5 Set the switches "~/-" and "1:1/1:10" to the positions "~" and "1:10" respectively.
A.5.2.6 Connect the measured signal to input A.
A.5.2.7 Turning the LEVEL knob to achieve a stable count (periodic blinking of the LED in the left corner of the display). If it is impossible to obtain a stable count, turn off the signal attenuation by setting the “1:1” position.
A.5.2.8 Read off the measurement result.
Notes:
1 After any switching, the first reading of the scoreboard may not be correct;
2 If the COUNT TIME ms/MULTI switch is set to 104, the count will be taken after 10 s.
A.5.3 Period measurement (input B)
A.5.3.1 Press the button Т (period) of the switch TYPE OF OPERATION.
А.5.3.2 Switch COUNT TIME ms/MULTIPLE set to position 100, and switch "TIME STAGS, s" - depending on the required accuracy. It is recommended to choose time marks 10-7 or 10-6 when measuring periods less than units of ms, and when measuring long periods (of the order of hundreds of ms or more) - 10-4 or 10-3.
A.5.3.3 Set the switches "~/-" to the position "-", " / " - to the position corresponding to the polarity of the pulses (in this work, the polarity of the pulses is positive), "1:1/1:10" - to position "1:10".
A.5.3.4 Apply the signal to be measured to input B and turn the level knob to achieve a stable count (periodic blinking of the LED in the left corner of the display). If necessary, turn off the attenuation of the input signal.
A.5.3.5 Read off the readings, measuring, if necessary, the indication time with the appropriate knob.
A.5.3.6 For more accurate results measurements, you can set the switch COUNTING TIME ms/MULT to one of the positions 101, 102, 103, 104, while the measurement will be performed respectively for 10, 100, 1000 or 10000 periods.
A.5.4 Measurement of pulse duration (input B)
A.5.4.1 Press the DURATION button of the OPERATION switch.
A.5.4.2 Follow 5.3.2 to 5.3.4.
A.5.4.3 Read the result.
A.5.5 Frequency ratio measurement (input A and B)
A.5.5.1 Press the “A/B” button of the OPERATION TYPE switch.
A.5.5.2 Apply a higher frequency signal to input A, a lower frequency signal to input B.
A.5.5.3 Set the "COUNTING TIME ms/MULTIPLE" switch to position 10° (if it is necessary to improve the measurement accuracy, it is allowed to set the switching switch to other positions).
A.5.5.4 Read the result. If there is no LED patience count), it is necessary to verify the presence of measurable signals at the inputs by measuring the frequency at input A and the period at input B (according to 5.2.1-5.2.8 and 5.3.1-5.3.5), and then repeat 5.5.1, 5.5.3.
Note – Other modes of operation of the frequency meter are not used in this laboratory work.