
Laboratory work #5 "Measurement of parameters of modulated signals"
1
PURPOSE OF THE WORK
1.1 Study of methods for measuring the parameters of modulated signals.
1.2 Study of the device and principle of operation of measuring instruments SKZ-43, G4-107 and the acquisition of practical skills in working with them.
2 SUMMARY OF THE THEORY
In radio engineering, electronics, communication engineering and other fields of science and technology, the analysis of the form of electrical signals allows you to obtain information about the quality of radio devices, communication lines, technological processes, etc. To carry out such an analysis and measure the parameters of the spectrum, modulation of electrical signals, a device of subgroup C is used (C3 is a meter of modulation parameters).
MEASUREMENT
OF MODULATION PARAMETERS.
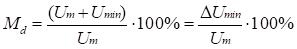
The amplitude-modulated signal during the modulation period T has the maximum Umax and minimum Umin values of the oscillation amplitude (respectively, there are the maximum and minimum values of the signal envelope). The values Mu and Md, respectively, are
 (1)
(1)
 (2)
(2)
where Um is the average value of the amplitude of the modulating signal over the period T and are called the modulation factor "UP" (Mu) and the modulation factor "DOWN" (Md). In the particular case of modulation with a harmonic signal
Mu = Md = Mav (3)
With frequency modulation, the carrier frequency of the signal is changed. In the case of modulation by a harmonic signal, we have
f(t) = f0 + Δf·sinΩt (4)
where Δf is the maximum deviation of the frequency of the modulated signal from the average value f0, corresponding to the amplitude of the modulating signal U.
Passing to the circular frequency, we get
ω(t) = ω0 + Δω·sinΩt (5)
The value Δf = Δω 2/π is called the frequency deviation. The ratio β = Δω/Ω = Δf/F is called the frequency modulation index.
In its structure (Figure 1), the modulation meter is a measuring receiver with the conversion of the carrier frequency of the input signal into an intermediate one. The operation of such meters is based on the signal demodulation method carried out at an intermediate frequency, during which a signal is selected that corresponds to the modulation law. Demodulation (depending on the type of signal) is performed using amplitude or frequency (phase) detectors.
The main requirements for the detector, determined by the problem of high-quality signal demodulation, are the linearity of its characteristics and low noise level.
The AM signal demodulator, in addition to the main function, usually also performs the function of a primary converter in the system of automatic stabilization of the average level of the carrier signal, which greatly simplifies the process of measuring the modulation coefficient.
Indeed, in the process of detecting a modulated signal, two detectors (which are part of the demodulator) separate out the constant Um and the variable Umin or Umax components of the envelope. The constant component is used to stabilize the level of the carrier signal, and the variable component (envelope) is subjected to further processing, which consists in filtering it and measuring the peak value of the positive and negative half-waves of the envelope.

Figure 1
Since the level of the carrier signal was automatically stabilized during the demodulation process, the measured positive and negative peak values of the envelope signal are presented using a scaler directly in units of modulation coefficients Mu, Md or Mav.
As frequency detectors, pulse detectors are most often used, which are characterized by a high conversion linearity. The operation of the detector is based on the principle of converting the FM signal into a sequence of video pulses with strictly specified amplitude and duration, the repetition rate of which corresponds to the modulation law. Thus, the FM signal is converted into a pulse-frequency modulated signal. After amplitude detection, the constant and variable components are separated from the received pulse signal. The first of them is used as a feedback signal in the tuning system for an intermediate frequency (IF). The variable component (envelope) is filtered and enters the IF path for processing and determining the frequency deviation, which is completely similar to the case of measuring the amplitude modulation coefficient.
3 INSTRUMENTS USED IN THE WORK
3.1 Modulation meter SKZ-43.
3.2 High-frequency signal generator G4-107.
4 DESCRIPTION OF THE LABORATORY SETUP
Laboratory layouts M1 and M2 are the sources of the following signals used in the measurement of harmonic distortion and spectrum parameters. The layouts include one master generator of rectangular pulse signals with a varying pulse repetition rate (for observing spectrograms and measuring signal spectrum parameters), and a set of bandpass filters of various quality factors to isolate the first harmonic of pulsed signals. Changing the repetition frequency and duration of pulse signals, as well as the bandwidth of band-pass filters, is carried out using the option switch. A simplified diagram of the m1 and m2 layouts is shown in figure 2.

Figure 2
5 GETTING STARTED
5.1 According to the recommended literature, study in detail the methods for measuring the parameters of amplitude- and frequency-modulated signals, non-linear distortions and analysis of the signal spectrum.
5.2 According to the applications of these guidelines, study the device, principle of operation and operation of the SKZ-43 and G4-T07 devices used in laboratory work, as well as the methodology for taking measurements with its help and assessing the errors in the results obtained.
5.3 Prepare a report (one per team) on laboratory work in accordance with the requirements of these guidelines (section 8).
5.4 Answer security questions.
5.5 Solve the problem.
Condition. A harmonic signal with a frequency of 1 MHz and amplitude Um was simulated by a sinusoidal signal, the frequency F and amplitude U of which are given in Table 1. Determine the amplitude modulation coefficient, frequency deviation and frequency modulation index, if it is known that the frequency of the output signal frequency modulator is determined by the following functional dependence Fmod = (10U +0.01F) kHz, where U is the amplitude of the modulating signal, V; F is the frequency of the modulating signal, kHz. The values of Um for each option are given in Table 1.
Table 1
|
Parameter |
Variant |
|||||||||
|
0 |
1 |
2 |
3 |
4 |
5 |
6 |
7 |
8 |
9 |
|
|
Um , V |
9 |
8 |
7 |
6 |
5 |
4 |
3 |
2 |
1 |
4 |
|
F, KHz |
10 |
11 |
12 |
13 |
14 |
15 |
16 |
17 |
18 |
19 |
|
U, V |
0,9 |
0,4 |
0,21 |
0,54 |
0,5 |
0,1 |
0,06 |
0,2 |
0,1 |
0,8 |
6 LABORATORY ASSIGNMENT
6.1 Measure the parameters of amplitude- and frequency-modulated signals.
7 HOW TO DO THE WORK
7.1 Fill in the measurements in accordance with clause 6.1 of the laboratory task. Measurements are carried out in the following sequence.
7.1.1 Prepare for measurements the SKZ-43 modulation meter and the G4-107 high-frequency signal generator in accordance with A.4 of Appendix A.
7.1.2 Set the G4-107 generator to the internal amplitude modulation mode, and the SKZ-43 device to the amplitude modulation measurement mode. Set the controls of the G4-107 generator to the positions corresponding to the first frequency point (table 2).
7.1.3 Based on the procedure described in B.5 of Appendix B of these guidelines, measure the amplitude modulation coefficient of the signal under study.
7.1.4 Switch the G4-107 generator to the internal frequency modulation mode, and the SKZ-43 device to the frequency deviation measurement mode. Set the controls of the G4-107 generator to the positions corresponding to the first frequency point (table 2).
7.3.5 Guided by the method B.5 of Appendix B of these guidelines, measure the frequency deviation of the frequency-modulated signal.
7.1.6 Repeat measurements of the amplitude modulation factor and frequency deviation for the remaining frequency points indicated in Table 2. Record the results of intentions in Table 3.
Table 2
|
Variant No. (n - brigade number) |
1 |
2 |
3 |
4 |
5 |
6 |
7 |
8 |
9 |
Frequency on the scale of the generator G4-107 MHz |
|
|
The position of the switch "MOD Depth %" of the generator G4-107 when operating in the mode |
АМ |
10 30 50 70 |
20 40 50 80 |
30 50 70 90 |
10 40 70 80 |
20 50 80 90 |
10 20 30 40 |
50 60 70 80 |
60 70 80 90 |
10 20 40 60 |
110 + 2n 82 + 1n 160 + 4n 50 + 3n |
|
FМ |
20 60 10 60 |
30 70 20 70 |
40 80 30 80 |
50 90 10 90 |
20 40 20 60 |
30 70 30 70 |
40 80 10 80 |
50 90 20 90 |
20 60 30 60 |
120 + 5n 67 + 7n 170 + n 60 + 3n |
|
Table 3
|
Parameters |
Switch position "Depth MOD %" G4 - 107» |
|||
|
Mu % |
|
|
|
|
|
Md % |
|
|
|
|
|
The error of graduation of the switch "Depth MOD %" |
|
|
|
|
|
Parameters |
Switch position "Depth MOD %" G4 - 107» |
|||
|
QAM measurement error |
|
|
|
|
|
Δf + kHz |
|
|
|
|
|
Δf – kHz |
|
|
|
|
|
β |
|
|
|
|
|
Frequency deviation measurement error |
|
|
|
|
|
Measurement error β |
|
|
|
|
7.1.7 Based on the frequency deviation measurement results, calculate the value of the frequency modulation index. Record the calculation results in table 3.
7.1.8 Using the technical characteristics of the SKZ-43 modulation meter, determine the instrumental errors in measuring the amplitude modulation coefficients and frequency deviation. Calculate, using expression (6), the measurement error of the frequency modulation index as an error of indirect measurement. Record the calculation results in table 3.
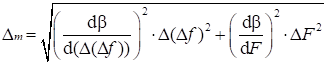 , (6)
, (6)
where Δ(Δf) – погрешность измерения девиации частоты;
ΔF – the error in setting the frequency of the modulated signal on the scale of the G4-107 generator.
7.1.9 Using the formulas for determining the absolute and relative measurement errors, determine the calibration error of the scale of the amplitude modulation depth switch of the G4-107 generator, considering the readings of the SKZ-43 device as the actual values of the amplitude modulation coefficient. Record the calculation results in table 3.
8 CONTENT OF THE REPORT
The report on laboratory work is drawn up on standard sheets of paper. Structural diagrams of the devices used in the performance of the work are drawn with the necessary designations and explanations. The results of measurements and calculations are summarized in tables, which must correspond to those given in the guidelines. The text of the report should contain the condition and progress of solving the problem given in 5.5 of these guidelines, as well as all information about the work done and conclusions based on the results of each item of the laboratory assignment. Information about the measuring instruments used must be drawn up in the form given in table 4.
Table 4
|
Device name |
Device type |
Serial number |
Basic technical characteristics |
|
|
|
|
|
|
|
|
|
|
APPENDIX A
MODULATION METER SKZ-4-3
A.1 PURPOSE
The modulation meter SKZ-43 is designed to measure the peak value of the frequency deviation and the amplitude modulation coefficient.
A.2 TECHNICAL DATA
A.2.1 Carrier frequency range from 4 to 1000 MHz in the frequency deviation measurement mode and from 0.15 to 500 MHz in the amplitude modulation measurement mode.
A.2.2 The frequency indication error does not exceed ±(0.005fc + 100 + count unit), where fc is the signal carrier frequency equal to (flo – 1MHz); flo is the frequency of the local oscillator, counted by the built-in frequency meter in MHz; count unit – the unit of account of the last digit of the frequency meter.
A.2.3 Parameters in frequency deviation measurement mode
A.2.3.1 Frequency deviation measurement limits from 1 to 500 kHz.
A.2.3.2 The basic frequency deviation measurement error in kilohertz does not exceed the values determined by the formulas:
– in the range of modulating frequencies from 0.4 to 5 kHz Δbas = ±(0.05Δf + fm);
– in the range of modulating frequencies from 0.03 to 0.4 kHz and from 5 to 20 kHz Δbas = ±(0.08Δf + fm);
– in the range of modulating frequencies from 20 to 60 kHz Δbas = ±(0.15Δf + fm),
where Δf is the measured deviation in kHz;
fm is the rms value of the self-hum and meter noise level in Hz.
A.2.3.3 Root-mean-square values of the intrinsic background and instrument noise levels depending on the frequency of the signal under study are given in Table 5.
A.2.4 Parameters in the amplitude modulation measurement mode
A.2.4.1 Measurement limits of the amplitude modulation coefficient from 1 to 100%.
A.2.4.2 The basic measurement error of the amplitude modulation coefficient in percent at the AM coefficient from 1 to 80% does not exceed the values determined by the formulas:
– in the range of modulating frequencies from 0.4 to 6 kHz Δbas = ±(0.05M + 0.5) with the 20 kGd filter on; Δbas = ±(0.05M + 1.0) with 60 kHz filter on;
– in the range of modulating frequencies from 0.03 to 0.4 kHz and from 6 to 20 kHz Δbas = ±(0.08M + 0.5) with the 20 kHz filter on; Δbas = ±(0.08M + 1.0) with 60 kHz filter on;
– in the range of modulating frequencies from 20 to 60 kHz Δbas = ±(0.1M + 1.0),
where M is the measured value of the AM coefficient, %
Table
5
|
Frequency |
Input signal level |
Baseband |
RMS value of self-hum and noise level |
|
MHz |
mV |
MHz |
Hz |
|
from 4 to 100 |
30 |
0,03 - 20,0 0,03 - 60.0 |
50 150 |
|
from 100 to 250 |
30 |
0,03 - 20,0 0,03 - 60,0 |
100 300 |
|
from 250 to 500 |
50 |
0.03 - 20.0 0,03 - 60.0 |
250 750 |
|
from 500 to 1000 |
300 |
0.03 - 20.0 0,03 - 60,0 |
250 750 |
A.2.5 The main QAM measurement error from 80 to 95% in the modulating frequency range from 0.4 to 6 does not exceed ± 0.05 М%. Measurement error, coefficient over 95% is not standardized.
A.2.6 Intermediate frequency of the instrument under normal conditions (1000 ± 100) kHz.
A.2.7 The input impedance of the device is 50 ohms with KOTi not more than 5 in the frequency range up to 1000 MHz.
A.3 PRINCIPLE OF OPERATION
The modulation meter is designed to measure the frequency deviation in the carrier frequency range of 4 - 1000 MHz and the amplitude modulation ratio (QAM) in the carrier frequency range of 0.15 -500 MHz. The block diagram of the modulation meter is shown in Figure A.1.
In the carrier frequency range of 4 - 1000 MHz, the modulation meter operates on the principle of a superheterodyne receiver with a single conversion of the signal frequency to an intermediate frequency of 1 MHz. In the carrier frequency range of 0.15 - 4 MHz, the modulation meter operates on the principle of direct amplification of the measured signal.
The measurement of frequency deviation is based on the conversion of a frequency-modulated intermediate frequency signal into a sequence of pulses with constant amplitude and duration, the time position of which corresponds to the modulation law of the measured FM signal. The modulation signal is extracted by a low-pass filter, detected by a peak detector and measured by a digital indicator.

Figure А.1
QAM measurement (M) is based on the two voltmeter method: measurement of the ratio of the peak (Um) value of the positive (+) or negative (–) half-waves of the detected AM signal to the average (Uav) value of the detected AM signal, which is kept constant (and equal to conventional unity) automatic level stabilization circuit
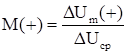 ,
, 
The modulation signal of the detected AM signal is extracted by a low-pass filter, detected by a peak detector, and measured by a digital indicator.
The internal calibrator simulates a signal with a calibrated frequency deviation of 500 kHz and a signal with an AM factor of 100%, which are used to set the gain, measurement path (instrument calibration).
Indication of the local oscillator frequency is carried out using the built-in frequency meter.
A.4 PREPARING INSTRUMENTS FOR OPERATION
A.4.1 Set the controls to the following positions:
- AFC toggle switch - to the lower position;
- switch "MHz ranges" - to the position "0.9 - 1.5".
The rest of the controls can be in any position.
A.4.2 Set the NETWORK toggle switch to the upper position. At the same time, the digital indicators of the device and the LOW indicator lamp should light up.
A.4.3 The device is tuned to the measured signal as follows (regardless of the operating mode):
- apply the measured RF signal to the “2.5V MAX” connector with a level not exceeding 2.5 V and not lower than the sensitivity of the device;
- put the switch "RANGES МНz" to the desired position
- in the sections 16 - 60 MHz and 170 - 1000 MHz, tuning is performed on the harmonics of the local oscillator (in this case, you should choose a lower harmonic number). By turning the SETUP knob counterclockwise from the right stop, the indicator lamps will light up LITTLE, MUCH. In this case, when the HETER CONTROL button is pressed, the digital indicators should display approximately the local oscillator frequency, which differs from the signal frequency by 1 MHz. Continuing the slow rotation of the SETTING knob, achieve the illumination of the indicator lights ABOVE, BELOW. When the bulb is lit HIGHER, the frequency of the local oscillator must be reduced, and when the bulb is lit BELOW, it must be increased.
A.5 MAKING MEASUREMENTS WITH THE INSTRUMENT
Frequency deviation measurement
A.5.1 Select the desired band by modulating frequencies by switching the toggle switch "BAND kHz 20, 60". It must be remembered that the maximum number of harmonics reproduced by the device is equal to the integer part of the ratio of 60 to the frequency of the first harmonic of the modulating signal.
A.5.2 Set the toggle switch "%, f kHz" to position "kNz".
A.5.3 Set the toggle switch "MODUL." to the "+" or - position, depending on the need to measure the positive or negative half-wave of the modulating voltage.
A.5.4 Read the measured value of the frequency deviation using the digital indicator.
A.5.5 AM modulation measurement
A.5.5.1 Set the toggle switch "%, kNz" to position "%".
A.5.5.2 Perform the operations similar to B.5.3 and count the AM coefficient on the digital indicator.
To reduce the measurement error of small QAM values (<5%), it is necessary, with the modulation of the measured object turned off, to set the level of the measured signal so that the CIM reading will be minimal.
APPENDIX B
HIGH-FREQUENCY SIGNAL GENERATOR G4-107
B.1 PURPOSE
The G4-107 generator is a source of unmodulated and modulated high-frequency signals and is intended for use in monitoring, adjusting and configuring various radio engineering devices.
B.2 TECHNICAL DATA
B.2.1 The device provides the following types of work:
– continuous generation (CG);
– amplitude modulation by sinusoidal voltage (AM);
– frequency modulation with a sinusoidal voltage (FM) without reporting the value of the frequency deviation;
– pulse modulation (PM).
B.2.2 Frequency parameters (F-parameters):
– frequency range 12.5–400 MHz, covered by five subbands;
– basic frequency setting error no more than ±1%;
B.2.3 Output voltage parameters (U-parameters) of the generator in the "NG" mode:
– output voltage at a matched load of 50 ± 1 Ohm, connected via a cable to the main output of the “dVV” generator, is regulated within (1–10-5) V;
– the main error of setting the reference value of the output voltage does not exceed ±1 dB;
- the output voltage is adjusted using an internal attenuator from 0 to 119 dB in steps of 1 dB and smoothly within each step;
– the main attenuation error of the internal attenuator does not exceed ±0.8 dB in the frequency range up to 200 MHz and ±1.5 dB in the frequency range above 200 MHz.
B.2.4 Amplitude modulation parameters (AM-parameters): amplitude modulation is carried out by a signal with a frequency of 1 kHz:
– from an internal modulation source;
- the amplitude modulation coefficient is adjustable within (0–90)% in steps of 10%;
– the basic error in setting the amplitude modulation coefficient does not exceed ±5% at 10% < M < 50% ±10% at 50% < M < 90%;
– the output voltage of the generator in the "AM" mode is 0.5 of the output voltage level in the "NG" mode.
B.2.5 Frequency modulation parameters (FM parameters):
– frequency modulation is carried out by a 1 kHz frequency signal from an internal modulation source;
- the maximum value of the frequency deviation in the internal FM mode is not less than 8,16,32,64 and 128 kHz in the corresponding frequency subbands;
- the output voltage level in the "FM" mode corresponds to the voltage level in the 2NG mode.
B.3 OPERATING PRINCIPLE OF THE GENERATOR
The block diagram of the generator is shown in Figure B.1 and consists of four main functional elements that provide the setting and counting of the signal frequency, output voltage level and amplitude modulation factor.
The setting and counting of the signal frequency is carried out in the master oscillator (MO), which determines all the frequency parameters of the device.

Figure B.1
The setting and reading of the output voltage level is provided using a broadband amplifier (BA), an attenuator (Att.), a detector (Det.) and a differential DC amplifier (Dif. DCA) with an adjustable reference voltage. located in the main channel of the device. The output signal is rectified by the detector and fed to the input of the differential DCA. The second input of the DCA receives a signal from the reference voltage regulator. The amplified difference of these signals changes the signal at the input of the broadband amplifier, ensuring that the level of the output voltage of the main channel of the generator is proportional to the reference voltage. Thus, at a constant reference voltage, the level of the generator output voltage is stabilized, and when it changes, the output voltage is smoothly adjusted within 1 dB. Step adjustment after 1 dB is carried out using the output attenuator.
Setting the depth of amplitude modulation is provided by a high-frequency modulator (attenuator based on p-i-n diodes) and low-frequency nodes, with the help of which a calibrated modulating signal is formed: an audio frequency generator, a voltage regulator with a detector, which allows, using an indicator device, to set a certain reference value of the modulating signal, and a low-frequency attenuator that provides discrete adjustment of the modulation depth in steps of 10%.
Frequency modulation of the oscillator signal is carried out by electronically tuning the frequency of the master oscillator using varicaps, to which the modulating signal of the audio frequency generator is applied. The level of this signal, set by the voltage regulator and the bass attenuator, determines the amount of frequency deviation.
B.4 PREPARING INSTRUMENTS FOR OPERATION
B.4.1 Set the controls to the following positions:
- AFC toggle switch - to the lower position;
- switch "MHz ranges" - to the position "0.9 - 1.5".
The rest of the controls can be in any position.
B.4.2 Set the NETWORK toggle switch to the upper position. At the same time, the digital indicators of the device and the LOW indicator lamp should light up.
B.4.3 The device is tuned to the measured signal as follows (regardless of the operating mode):
- apply the measured RF signal to the “2.5V MAX” connector with a level not exceeding 2.5 V and not lower than the sensitivity of the device;
- put the switch "RANGES МНz" to the desired position
- in the sections 16 - 60 MHz and 170 - 1000 MHz, tuning is performed on the harmonics of the local oscillator (in this case, you should choose a lower harmonic number). By turning the SETUP knob counterclockwise from the right stop, the indicator lamps will light up LITTLE, MUCH. In this case, when the CONTROL HETER button is pressed, the digital indicators should display approximately the local oscillator frequency, which differs from the signal frequency by 1 MHz. Continuing the slow rotation of the SETTING knob, achieve the illumination of the indicator lights ABOVE, BELOW. When the bulb is lit HIGHER, the frequency of the local oscillator must be reduced, and when the bulb is lit BELOW, it must be increased.
B.5 MAKING MEASUREMENTS WITH THE FREQUENCY DEVIATION MEASUREMENT INSTRUMENT
B.5.1 Select the desired band by modulating frequencies by switching the toggle switch "BAND kHz 20, 60". It must be remembered that the maximum number of harmonics reproduced by the device is equal to the integer part of the ratio of 60 to the frequency of the first harmonic of the modulating signal.
B.5.2 Set the toggle switch "%, f kHz" to position "kNz".
B.5.3 Set the toggle switch "MODUL." to the "+" or - position, depending on the need to measure the positive or negative half-wave of the modulating voltage.
B.5.4 Read the measured value of the frequency deviation using the digital indicator.
B.5.5 AM modulation measurement
B.5.5.1 Set the toggle switch "%, kNz" to position "%".
B.5.5.2 Perform the operations similar to B.5.3 and count the AM coefficient on the digital indicator.
To reduce the measurement error of small QAM values (<5%), it is necessary, with the modulation of the measured object turned off, to set the level of the measured signal so that the CIM reading will be minimal.