
Laboratory work #6 "Measurement of non-linear distortion of signals"
1 PURPOSE OF THE
WORK
1.1 Study of non-linear distortions of signals.
1.2 Study of the device and principle of operation of the C6-5 measuring device and the acquisition of practical skills in working with it.
2 SUMMARY OF THE THEORY
In radio engineering, electronics, communication engineering and other fields of science and technology, the analysis of nonlinear distortions of electrical signals allows obtaining information about the quality of radio devices, communication lines, technological processes, etc. To carry out such an analysis and measure the distortion of electrical signals, a device of subgroup C is used (C6 - meters of nonlinear distortion of signals).
NONLINEAR DISTORTION MEASUREMENT
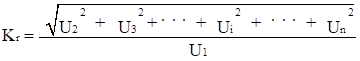
Nonlinear distortion refers to any change in the shape of the signal due to the non-linearity of the transmission path. The range of parameters used to quantify non-linear distortions is quite extensive. However, in practice, most often, to assess the nonlinear distortion of signals, the harmonic coefficient (Kr) is used, which characterizes the ratio of the rms value of the voltage of the resulting harmonic components to the rms value of the voltage of the fundamental frequency (1).
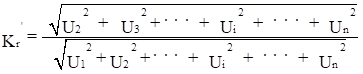
The value of Kr can vary from zero to infinity, which is convenient from a practical point of view. Therefore, in practice, to assess non-linear distortions, a modified harmonic coefficient Kr' is used, which is the ratio of the root mean square value of the voltage of higher harmonic components to the root mean square value of the distorted signal (2).
 ,
(1)
,
(1)
 (2)
(2)
The values of Kr already change in the range from 0 to 1.
Practically in all mass-produced measuring non-linear distortions of signals, the so-called fundamental frequency suppression method is implemented. It consists in separate measurement of the rms voltage of the distorted signal and the rms voltage of higher harmonics (without the first) of the same signal, i.e. the measurement Kr' is realized. A simplified diagram of a meter that implements this method is shown in Figure 1.
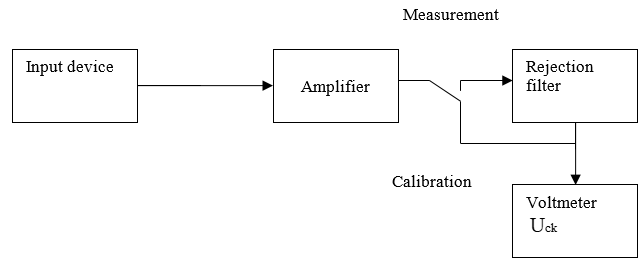
Figure 1
The Kr measurement is preceded by the meter calibration mode, as a result of which the voltmeter readings corresponding to the root mean square value of the distorted signal are set equal to the conventional unit (100%). Then, when the fundamental frequency signal is suppressed using a notch (trap) filter, the measured rms value of higher harmonics will be proportional to Kr.
The main sources of errors in measuring the harmonic coefficient are the characteristics of the voltmeter, as well as the inaccuracy of setting the notch filter to the frequency of the fundamental harmonic and compensating for the attenuation of higher harmonics.
3 INSTRUMENTS USED IN THE WORK
3.1 Nonlinear distortion meter S6-5.
4 GETTING STARTED
4.1 According to the recommended literature, study in detail the methods of non-linear distortion and signal spectrum analysis.
4.2 According to the appendix of this guideline, study the device, principle of operation and operation of the S6-5 device used in laboratory work, as well as the methodology for carrying out measurements with its help and assessing the errors in the results obtained.
4.3 Prepare a report (one per team) on laboratory work in accordance with the requirements of these guidelines (section 7).
5 LABORATORY ASSIGNMENT
5.1 Observe the spectrum of signals at the output of the devices under study and measure their non-linear distortions.
6 HOW TO DO THE WORK
6.1 Perform measurements in accordance with 6.2 of the laboratory task. Measurements are carried out in the following sequence.
6.1.1 Prepare the device for measurements in accordance with A.4 Appendix A.
6.1.2 Switch the OPTION of the layout M2 to set the number of the option in accordance with the number of the brigade according to table 1.
Table 1
|
Brigade number |
1 |
2 |
3 |
4 |
5 |
6 |
7 |
8 |
9 |
10 |
|
Variant number |
1 |
2 |
3 |
4 |
4 |
3 |
2 |
1 |
2 |
4 |
6.1.3 Based on the procedure described in A.5, measure the coefficient of non-linear signal distortion for four positions of the POINT NUMBER switch of the M2 layout. Record the measurement result in table 2.
6.1.4 Using the technical characteristics of the C6-5 device. determine the instrumental errors in measuring the coefficients of non-linear distortion of signals. Record the calculation results in table 2.
Table 2
|
Options |
Signal number (switch position) "Point number" |
|||
|
|
|
|
|
|
|
Kr, % |
|
|
|
|
|
Kr', dB |
|
|
|
|
|
Measurement error |
|
|
|
|
7 CONTENT OF
THE REPORT
The report on laboratory work is drawn up on standard sheets of paper. Structural diagrams of the devices used in the performance of the work are drawn with the necessary designations and explanations. The results of measurements and calculations are summarized in tables, which must correspond to those given in the guidelines. The text of the report should contain information about the work done and conclusions based on the results of each item of the laboratory assignment. Information about the measuring instruments used must be drawn up in the form given in table 3.
Table 3
|
Device name |
Device type |
Serial number |
Main technical characteristics |
|
|
|
|
|
|
|
|
|
|
APPENDIX A
Nonlinear distortion meter S6-5
A.1 PURPOSE
The C6-5 non-linear distortion meter is designed to measure the harmonic factor.
A.2 TECHNICAL DATA
A.2.1 The frequency range of the studied signals when measuring the harmonic coefficient is 20 Hz - 200 kHz, covered by eight subranges. Input voltage range 0.1 - 100 V.
A.2.2 The range of measured harmonic coefficients (0.03 - 100)%, broken down into seven scales.
A.2.3 The limits of the intrinsic error of measurement of the harmonic coefficient are given in Table A.1.
Table A.1
|
Frequency range |
Error |
|
|
When Kr < 30 % |
When Kr > 30 % |
|
|
20 Hz – 20 kHz 20 kHz – 200 kHz |
± (0,05 Klim + 0,02) ± (0,1 Klim + 0,1) |
0,15 Kh 0,25 Kh |
Klim – limit value of the corresponding scale, %
Kh – measured harmonic distortion value, %
A.3 PRINCIPLE OF OPERATION
The principle of operation of the device is based on measuring the rms voltage of the signal under study and the rms voltage of the higher harmonics of the same signal. A simplified block diagram of the device is shown in Figure A.1.
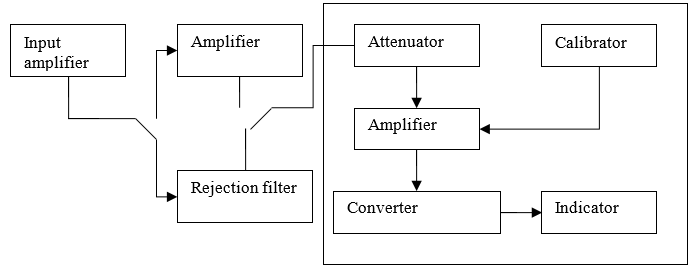
Figure А.1
Separate measurement of the voltages of the signal under study and its higher harmonics is provided using a selective amplifier containing a preamplifier, a notch filter (Wien's bridge) with switching circuits, and an amplifier of harmonics.
The measurement of the voltage of the entire signal corresponds to the calibration mode of the device, when the voltage amplified by the preamplifier is directly applied to the input of an electronic voltmeter, the arrow of which is set to a mark conventionally taken as unity (mark 10 on a scale of 100%). When measuring higher harmonics, the signal additionally passes through a notch filter and a harmonic amplifier, after which it is fed to the input of a voltmeter. To suppress the voltage of the fundamental harmonic in the entire frequency range of the studied signals, a switching circuit of the Wien bridge elements is provided, which provides switching of frequency subranges and smooth tuning (balancing of the bridge) within each subrange.
A.4 PREPARING THE INSTRUMENT FOR OPERATION
A.4.1 Connect the instrument to the source of signals under test using a cable and set the instrument controls to the following positions:
- the switch of the type of work - to the position "Caliber";
- switch of measurement limits - to the position of 100% on the Kr scale, %;
- switch CALIBER - to the middle position;
– FREQUENCY SCALE and RANGE switches – to the positions corresponding to the point number (Table A.2).
Table A.2
|
Parameter |
Parameter value |
|||
|
Point number |
1 |
2 |
3 |
4 |
|
Key position FREQUENCY SCALE |
pressed |
not pressed |
pressed |
not pressed |
|
Switch position RANGE |
х1 |
х10 |
х10 |
х100 |
A.4.2 Turn on the instrument and calibrate the instrument. To do this, use the CALIBER knob to set the instrument pointer to 10 on the 100% scale.
A.5 MAKING MEASUREMENTS WITH THE INSTRUMENT
A.5.1 Set the switch for the type of work to position "Kr". Achieve the minimum deviation of the arrow of the indicator by sequentially adjusting the "FREQUENCY Hz" and BALANCE knobs, increasing the sensitivity of the device using the switch for measurement limits. The resulting minimum instrument reading corresponds to the Kr value in percent.
A.5.2 To obtain a reading in dB, it is necessary to recalibrate the device to 0 dB (lower scale of the indicator) with the switch for the measurement limits set to 0 dB. After that, switch to the measurement mode by pressing the "Kr" key and, having set the required measurement limit, read the measured value of the harmonic coefficient as the sum of the readings of the indicator scales and the measurement limit switch in decibels.